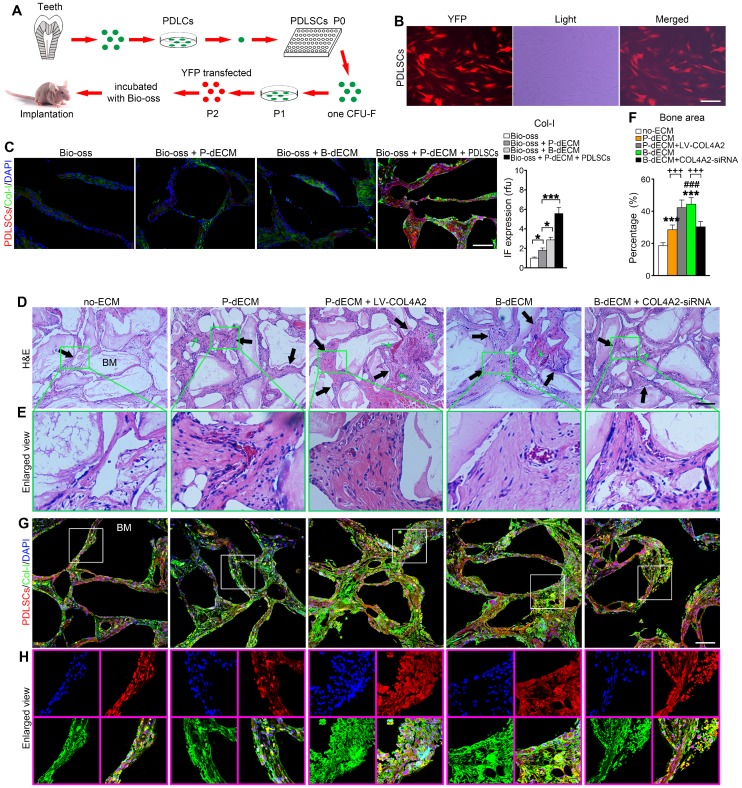
Figure 6.
Formation of new bone-like tissue in immunocompromised mice with cell tracing of PDLSCs. (A) Schematic diagram of PDLSC implantation in the back of immunocompromised mice. (B) PDLSCs transfected with YFP fluorescence. (C) Cell tracing and comparison of different effects of implantation of dECM, Bio-Oss, and PDLSCs. Four PDLSC/dECM/Bio-Oss combinations were implanted into immunocompromised mice. Double labeling of PDLSCs and Col-I was used to examine osteogenic ability and trace cells. White bar, 200 µm. Quantitative analysis of Col-I expression (right panel). * P < 0.05 and *** P < 0.001 represent significant differences in the indicated columns. (D) H&E staining revealed more bone-like tissue and insertion of PDL-like fibers in B-dECM and P-dECM than in the no-ECM group. This effect was increased in the P-dECM + LV-COL4A2 group compared with the P-dECM group. B-dECM + COL4A2-siRNA exhibited the opposite result. Black arrow, newly formed bone-like tissue. Green arrow, newly formed vessels. (E) Higher magnification of H&E staining. Green box represents the enlarged area. (F) Quantitative analysis of the new bone area in H&E staining images was carried out using Image-Pro Plus 6.0 software. (G) Cell tracing study in immunocompromised mice. (H) Higher magnification of cell tracing study. BM, bone meal from Bio-Oss. Black bar and white bar, 200 µm. The data are presented as the means ± SD; n = 6. *** P < 0.001 represents significant differences in the indicated columns (P-dECM and B-dECM) compared with the no-ECM group. ### P < 0.001 represents significant differences between the P-dECM and B-dECM groups. +++ P < 0.001 represents significant differences between the P-dECM or B-dECM group and the P-dECM + LV-COL4A2 or B-dECM + COL4A2-siRNA group.

