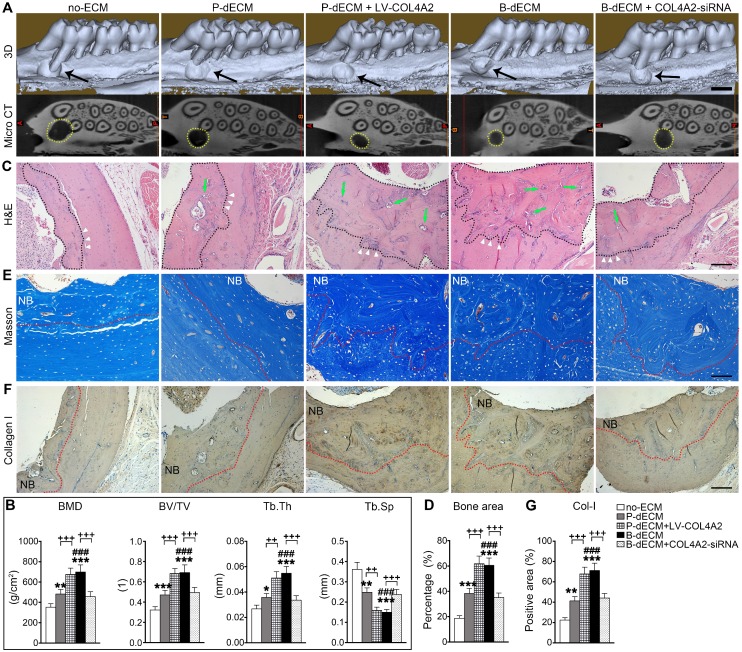
Figure 9.
Effects of PDLSCs cultured on specific dECMs and no-ECM on the repair of alveolar bone defects at 8 weeks following transplantation. (A) Representative images of micro-CT 3D images and horizontal cross section. Black arrow, the size of the alveolar bone defects after implantation. Yellow dots, the size of the alveolar bone defects after implantation in the horizontal cross section. Black bar, 1 mm. (B) Bone morphology analysis of the BMD, BV/TV, Tb.Th and Tb.Sp values in alveolar bone defects in rats treated with PDLSCs cultured on specific dECMs and no-ECM at 8 weeks following transplantation. (C) H&E staining of bone defects in these five groups. Black dots, the area of new bone in the defects. Green arrow, newly formed blood vessels. Black bar, 200 µm. (D) Quantitative analysis of the new bone area; H&E staining analysis was carried out using Image-Pro Plus 6.0 software. (E) Masson staining for new bone and fibers. NB, new bone. Red dots, the area of new bone in the defects. Black bar, 200 µm. (F, G) Immunohistochemical staining of Col-I in alveolar bone defects in rats treated with PDLSCs cultured on specific dECMs and no-ECM after 8 weeks of transplantation and quantification of the Col-I-positive area. NB, new bone. Red dots, the area of new bone in the defects. Black bar, 200 µm. The data are presented as the means ± SD; n = 6. * P < 0.05, ** P < 0.01 and *** P < 0.001 represent significant differences in the indicated columns (P-dECM and B-dECM) compared with the no-ECM group. ### P < 0.001 represents significant differences between the P-dECM and B-dECM groups. ++ P < 0.001 and +++ P < 0.001 represent significant differences between the P-dECM or B-dECM group and the P-dECM + LV-COL4A2 or B-dECM + COL4A2-siRNA group.

