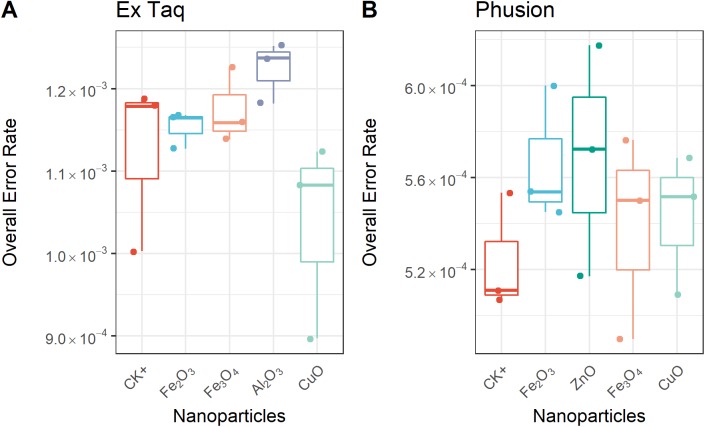
Figure 4. Overall error rate per base of the PCR products with or without NPs added to the PCR reaction.
The frequency of single nucleotide variation (SNV) in PCR products when using either Ex Taq (A) or Phusion (B) polymerases was analyzed, as described in the Methods. The box definitions are as per Fig. 3. The differences between NP-treated PCR reactions and the positive control (CK+) were compared using ANOVA. No group showed a difference at a significance level of p < 0.05.

