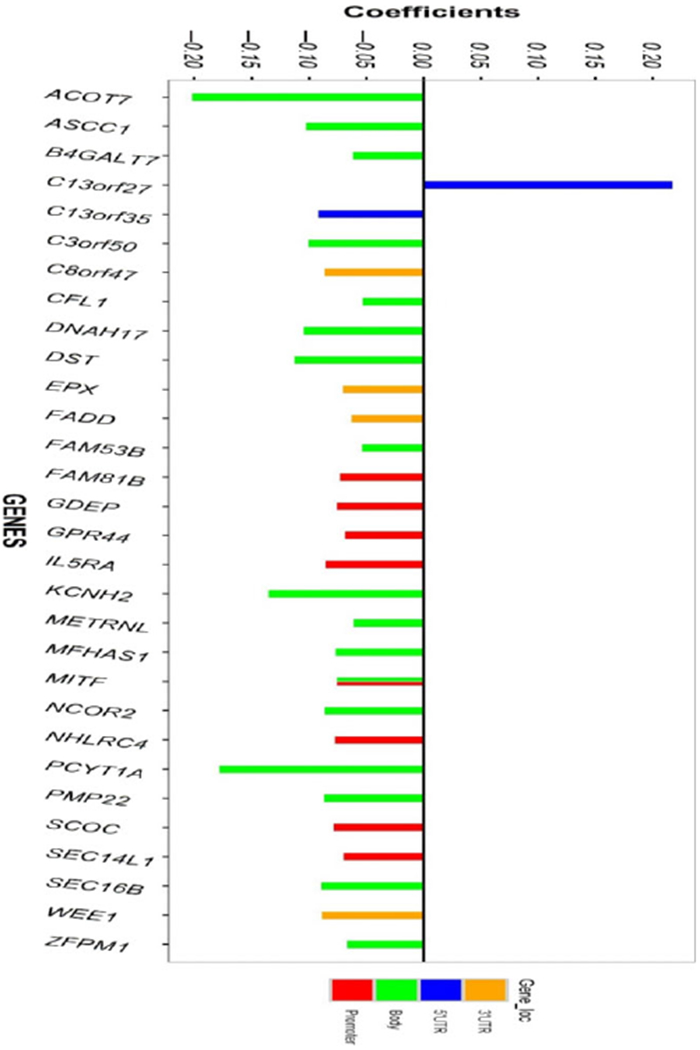
FIGURE 1.

Bar plots of the regression coefficients and the location of CpGs on their corresponding genes. The coefficients represent changes in DNA methylation associated with allergic sensitizations. Negative coefficients reflect decrease in DNA methylation in sensitized patients
