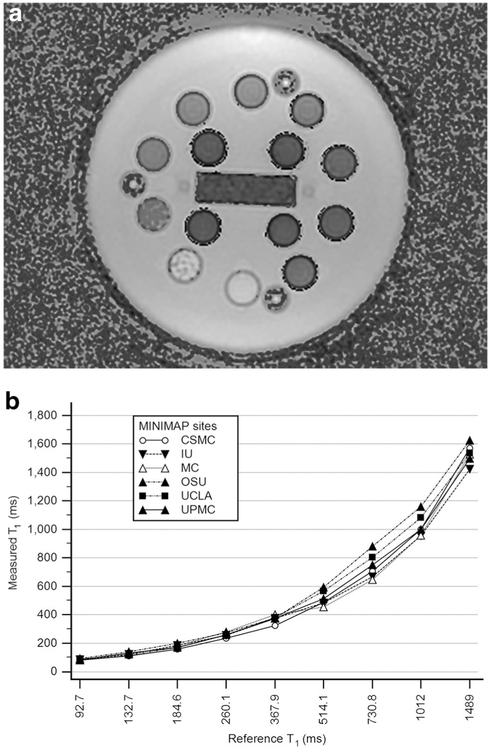
Fig. 2.
Phantom testing and protocol optimization will be performed as each institution before imaging of study subjects. a. This is a T1 image created using the T1 phantom. Each small sphere represents the measured T1 of the elements within the T1 phantom. The elements are 20 mm spheres filled with solutions of T1 ranging from 20 ms to 2000 ms and values have been verified by the National Institute of Standards and Technology (NIST). b. Results of phantom testing at study sites. Optimization to the dual flip-angle SPGR parameters will be made for each institution according to the phantom test results

