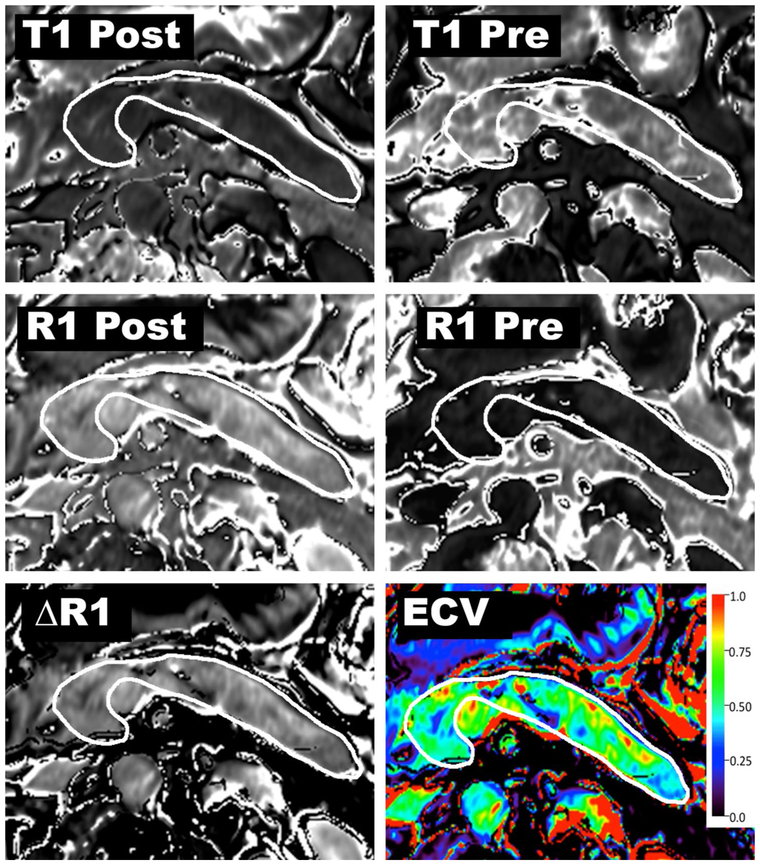
Fig. 4.
Imaging and post-processing steps for creation of an ECV map. T1 relaxation times obtained from the pancreas and the aortic lumen (blood pool) in pre-contrast and 6-min delayed phases will be used to calculate the ECV fraction. T1 is a time constant describing the longitudinal relaxation rate, and its reciprocal (1/T1) is referred to as R1. The change in R1 is ΔR1 = (R1post-contrast) – (R1pre-contrast). In the final step, ECV of the pancreas is calculated using ΔR1pancreas and ΔR1blood

