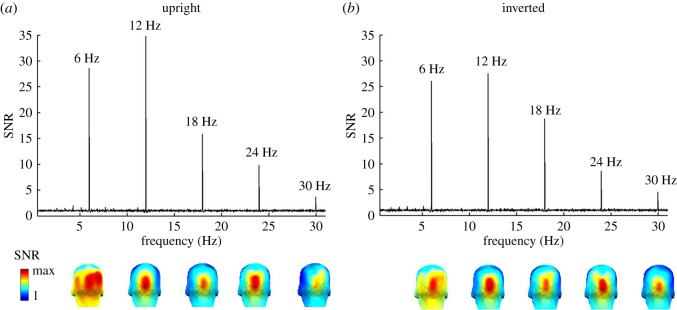
Figure 2.
Grand-averaged EEG spectra in SNR over the medial occipital region of interest (ROI) (averaged across channels POOz, Oz, OIz, and Iz). A SNR of 35 corresponds to 3400% of amplitude increase relative to EEG noise level. Responses at 6 Hz and subsequent harmonics (e.g. 12 Hz, 18 Hz, 24 Hz and so forth), shown separately for (a) upright and (b) inverted face stimuli. Three-dimensional scalp maps are shown below for significant harmonics, showing consistent topographies across face orientation conditions. Colour scale indicates the range from 1 to the maximum SNR for each individual harmonic.

