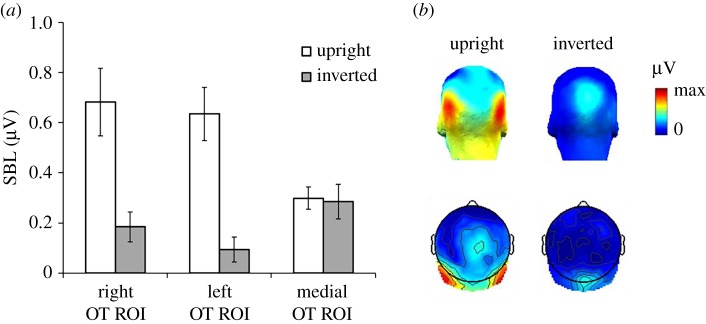
Figure 4.
(a) Sum of 0.86 Hz response and significant harmonics (in μV) plotted separately for upright and inverted sequences at the two OT ROIs, right versus left hemisphere, and the medial occipital ROI. (b) Three-dimensional (top) and two-dimensional (bottom) topographic scalp maps of the two face orientation conditions for the individual face recognition response. The colour scale indicates the range from 0 to the maximum amplitude (in μV) across two face conditions.

