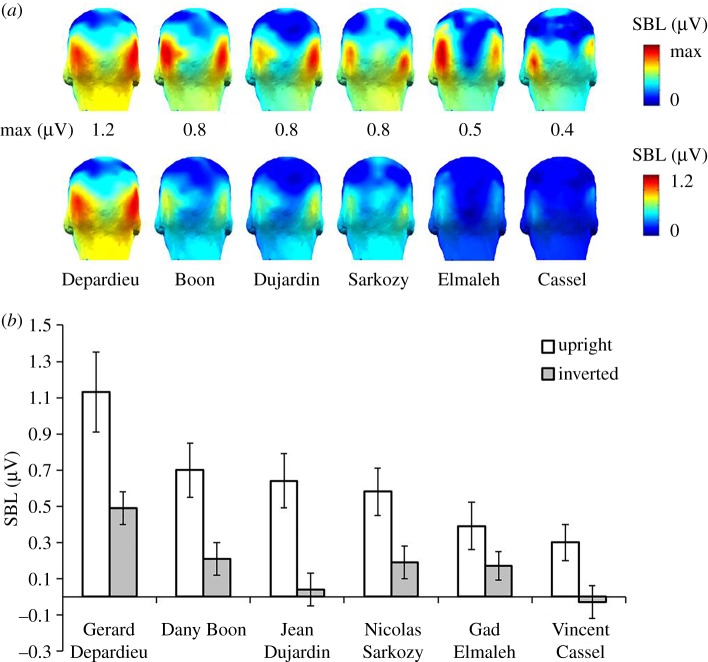
Figure 5.
Sum of baseline-corrected responses at 0.86 Hz and harmonics (in μV) shown individually for each of the six familiar face identities over OT ROI. (a) Scalp maps for each face identity (individual maxima upper panel, same scale lower panel) on upright sequences and (b) mean amplitudes to individual identities for the two types of trials.

