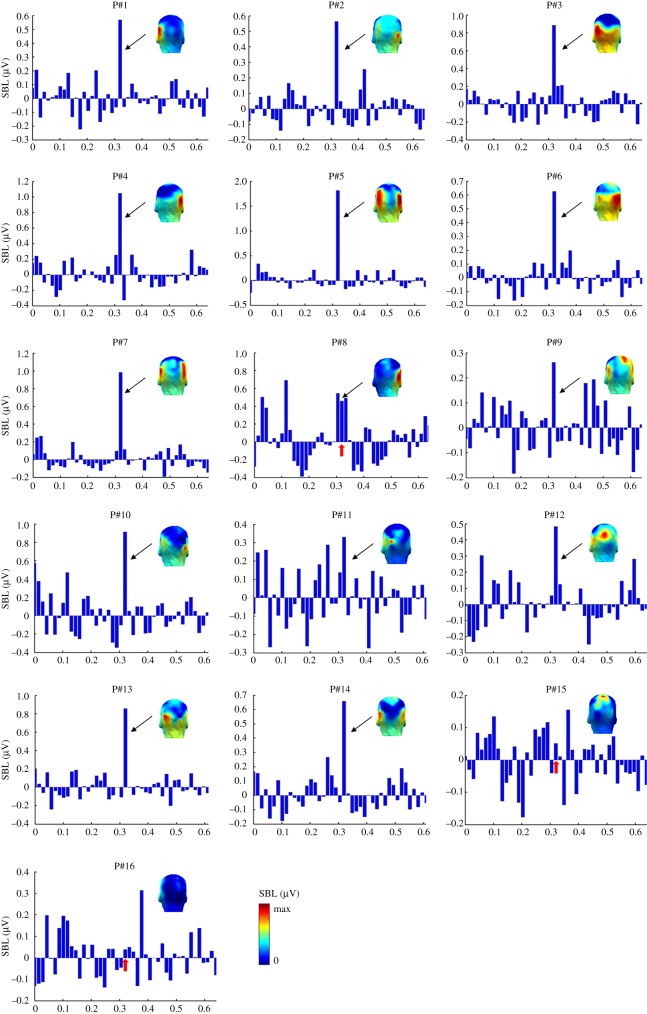
Figure 6.
Topographic scalp maps and bar graphs of summed amplitudes (in µV) of baseline-corrected mean amplitudes (sum at 0.86 Hz and harmonics) at the OT ROI (averaged across 4 channels: P9 & 10, PO11 & 12) for upright images, shown separately for individual participants. Each subplot is showing the amplitudes of 45 bins with the middle one indicating the frequency bin of our interest (i.e. 0.86 Hz). The unit of the x-axis of each subplot is arbitrary. Note that P15 and P16 did not show a significant response at the OT ROI. The colour scale indicates the range from 0 to the maximum baseline-corrected amplitude for each subject.

