
Figure 3.
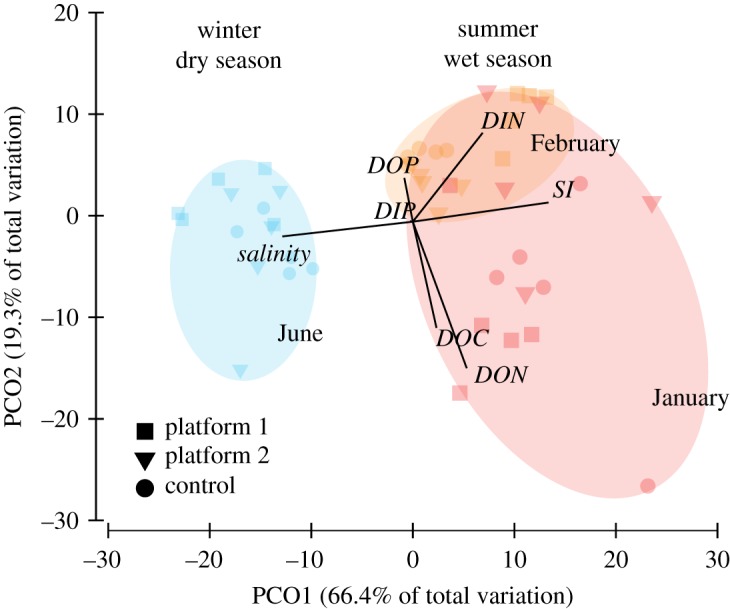
Two-dimensional principal coordinates plot visualizing relationships among concentrations of water quality variables and salinity during sampling months in the wet season denoted as clusters in January (red) and February (orange) and the dry season in June (blue) for each of the sampling locations. DIP, dissolved inorganic phosphorus; Si, silicates; DIN, dissolved inorganic nitrogen; DOP, dissolved organic phosphorus; DON, dissolved organic nitrogen; DOC, dissolved organic carbon. n = 5 replicate measurements per site per month.