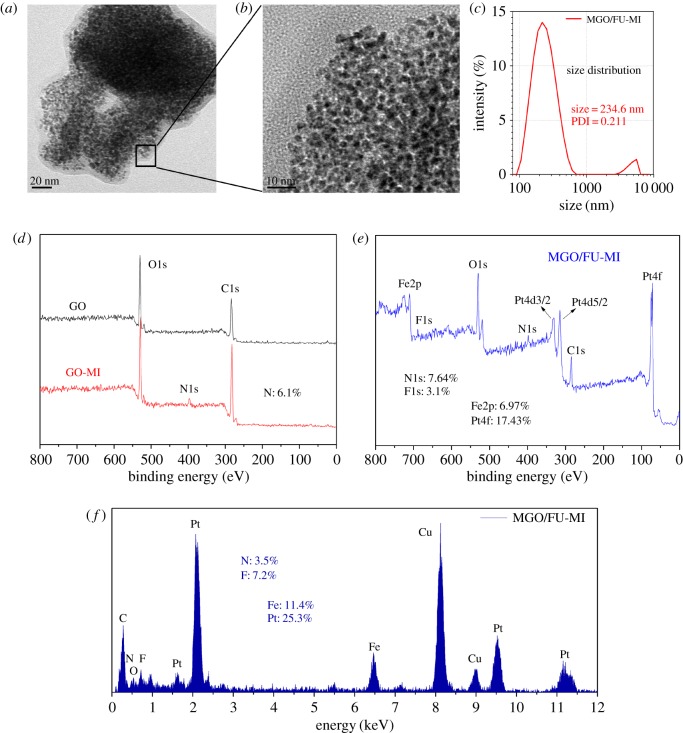
Figure 2.
Characterization of the NCs. TEM micrographs of MGO/FU-MI NCs in scale of (a) 20 nm and (b) 10 nm. (c) DLS of MGO/FU-MI NCs, with an average diameter was 243.6 nm. (d,e) XPS spectra of GO, GO-MI, MGO/FU-MI NCs, which characterize the chemical composition changes along the synthesis. (f) EDS analysis of MGO/FU-MI NCs.

