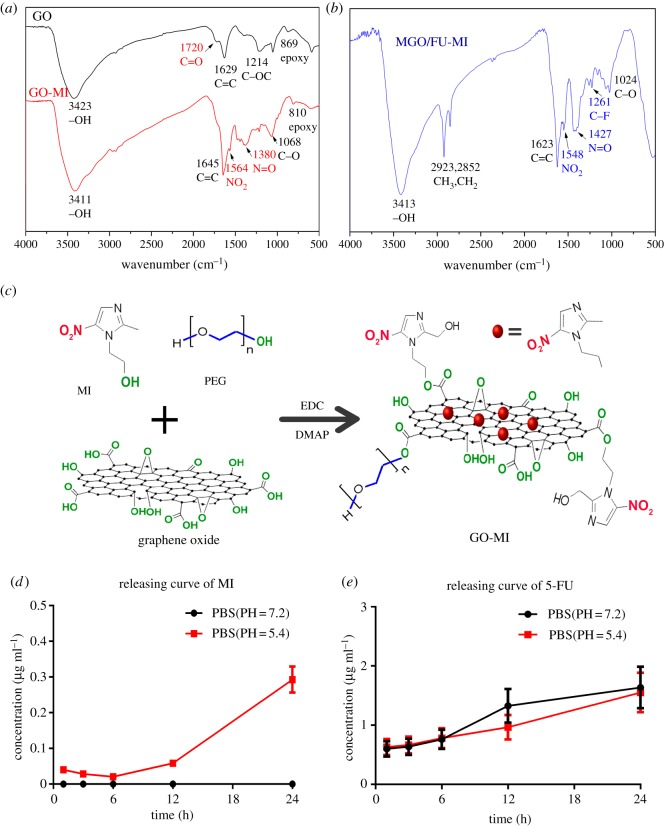
Figure 3.
Chemical structure and drug releasing character of the NCs. The FT-IR spectra of (a) GO and GO-MI (b) MGO/FU-MI NCs, which characterize the chemical structure changes of the NCs along the synthesis. (c) Schematic illustration of the EDC chemistry. The releasing curves of (d) MI and (e) FU in phosphate buffer solution (PBS) with PH values of 7.2 and 5.4.

