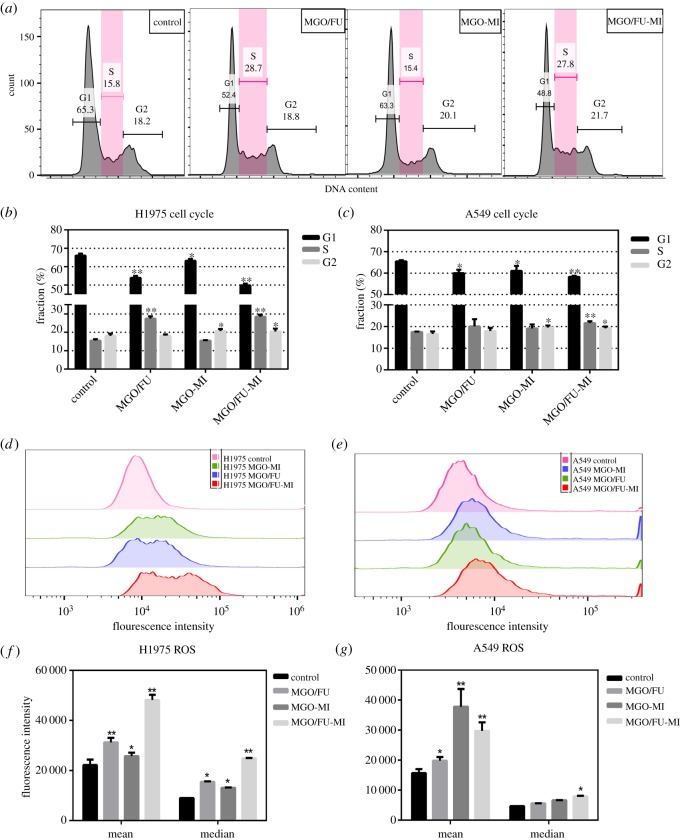
Figure 5.
The antitumour mechanism analyses of the NCs. (a) One of the results of cell cycle regulation analysis of H1975 cells treated by MGO/FU, MGO-MI and MGO/FU-MI NCs at 20 µg ml−1. Statistical analysis of cell cycle regulation of (b) H1975 and (c) A549 cells of three independent experiments, the values ware expressed as mean ± s.d. *p < 0.05, **p < 0.01. The intracellular ROS level of (d) H1975 and (e) A549 cells treated by MGO/FU, MGO-MI and MGO/FU-MI NCs at 20 µg ml−1. Statistical analysis of intracellular ROS level of (f) H1975 and (g) A549 cells of three independent experiments, the values ware expressed as mean ± s.d., *p < 0.05, **p < 0.01.

