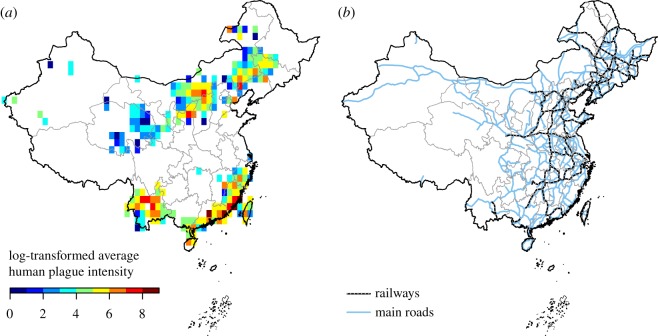
Figure 1.
Human plague intensity in mainland China from 1772 to 1964 and transportation routes. (a) Average human plague intensity (average number of annual human cases when plague occurred) after logarithmic transformation in 1° grids in mainland China. Colours show grids with presence of plague. (b) Historical railways and main roads in mainland China.

