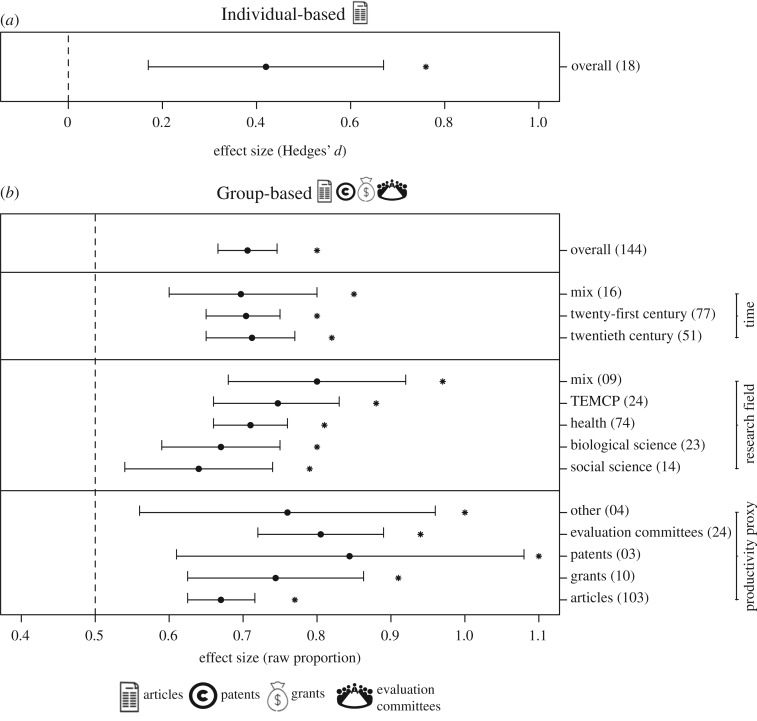
Figure 2.
The gender productivity gap in science. The mean effect sizes ± 95% confidence intervals corresponding to (a) individual- and (b) group-based studies comparing productivity between men and women scientists (Pindividual = 0.0012, Pgroup < 0.0001). The number of observations included in each meta-analysis is reported within parentheses. For group-based studies, the effect sizes of gender productivity depending on the productivity proxy (p = 0.036), the research field (p = 0.189) and the time period (p = 0.951) are also shown. The vertical dashed line in each graphic indicates no difference between men and women scientists. Positive effect size values indicate higher men productivity, whereas negative effect sizes indicate higher women productivity. Asterisks denote the mean effect sizes significantly different from zero for Hedges' d and 0.5 for raw proportion (p < 0.05). Icons illustrate the type of primary response variable included in each meta-analysis.

