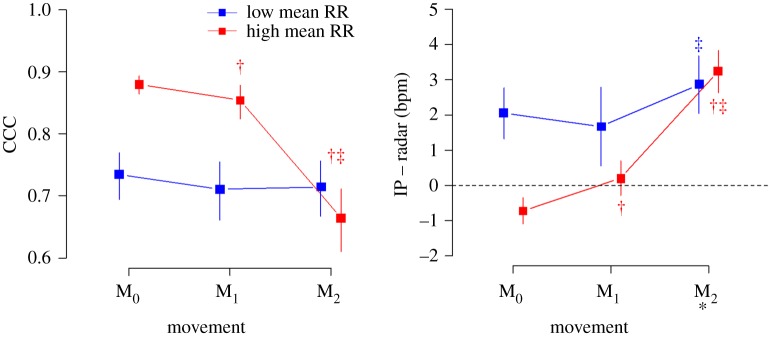
Figure 6.
Concordance correlation coefficients (CCCs) and the mean bias levels according to the movement levels and mean RRs. The levels of agreement were better in patients with high mean RRs than those in patients with low mean RRs in M0 and M1, whereas the levels of agreement were similar or even worse in patients with high mean RRs compared with those with low mean RRs in M2. * p > 0.05 in low versus high mean RRs (p < 0.05 in all the other pairs). † p < 0.05 versus M0. ‡ p < 0.05 versus M1 within the same RR level.

