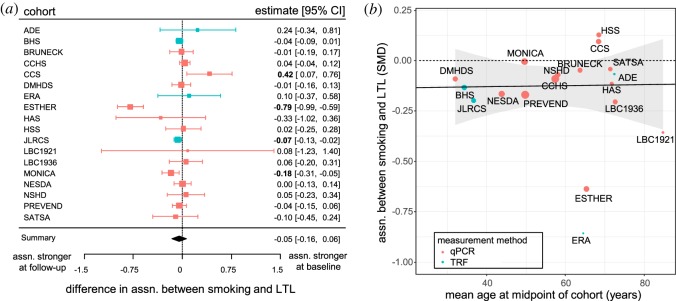
Figure 3.
The difference in LTL between smokers and non-smokers does not increase with more years of smoking. (a) Forest plot showing the lack of difference in association between smoking and LTL between baseline and follow-up (model 4). For key see figure 2. (b) Scatterplot showing that the association between smoking and LTL does not change as the mean age of the cohort increases. Each point represents one cohort and the area of the point is proportional to the weight in model 5. The solid black line shows the non-significant estimate from a random-effects meta-regression model obtained by adding mean age of the cohort as a moderator to model 5. The ribbon shows 95% CI for the estimate. The dashed line indicates no effect of smoking on LTL.

