Figure 5.

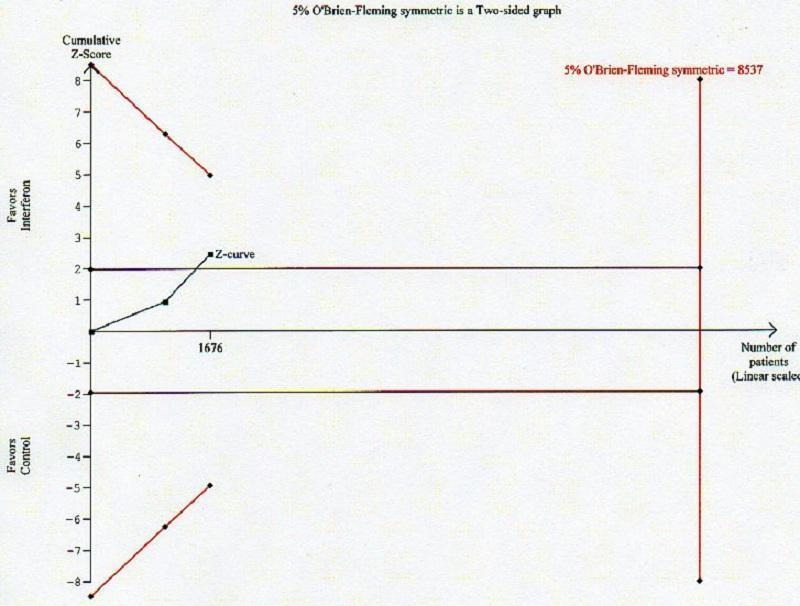
Trial sequential analysis for low risk of bias trials reporting rates of variceal bleeding in both groups. Assumptions were 2% incidence in control arm, RR = 0.50, alpha error 5%, power 80%.The required information size was 8537 patients.

Trial sequential analysis for low risk of bias trials reporting rates of variceal bleeding in both groups. Assumptions were 2% incidence in control arm, RR = 0.50, alpha error 5%, power 80%.The required information size was 8537 patients.