
3.
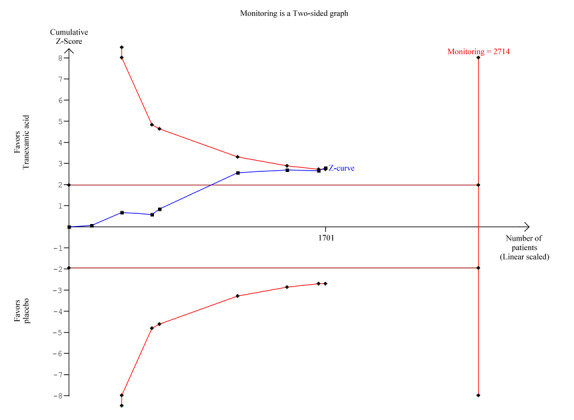
Trial sequential analysis of eight trials on tranexamic acid versus placebo or no intervention. Outcome measure is mortality. Analysis was performed with alpha 5% and power 80%. Model‐based heterogeneity correction was 0%, relative risk reduction 30% and control group incidence 10%. Graph shows the Z‐curve, which is the cumulative result of analysis with trials added according to year of publication. Horizontal line represents 'traditional' 5% level of significance, and inward sloping red line shows trial sequential monitoring boundary. Vertical line represents required information size. Analysis shows that the Z‐curve crosses the trial sequential monitoring boundary, suggesting that the result of the meta‐analysis is confirmed when analysis is adjusted for cumulative testing. Total number of included participants (N = 1701) is only 62% of required information size (N=2714). The meta‐analysis therefore remains inconclusive.