Figure 1.

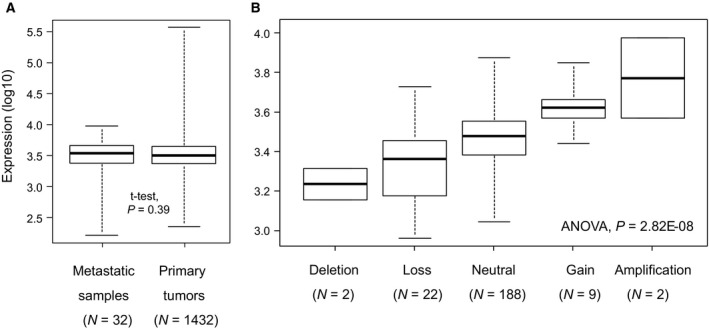
PARP1 expression in STS. (A) Box plots showing PARP1 mRNA expression level (log10) in 1432 STS primary tumors and 32 STS metastases. For each box plot, median and ranges are indicated. (B) Similar to (A) but applied to the 224 TCGA STS primary tumors and according to PARP1 DNA copy number (SNP array).
