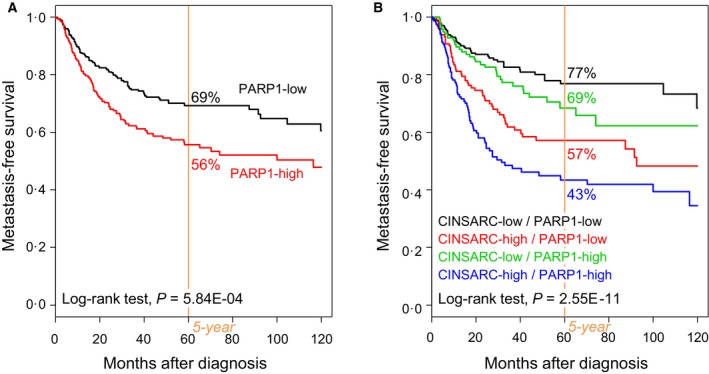
Figure 2.

MFS in patients with STS according to PARP1 expression. (A) Kaplan–Meier MFS curves in all patients with STS, according to the PARP1‐based classification (‘PARP1‐low’ and ‘PARP1‐high’ classes). (B) Similar to A, but according to the 4‐class classification based on both PARP1 expression and CINSARC signature.
