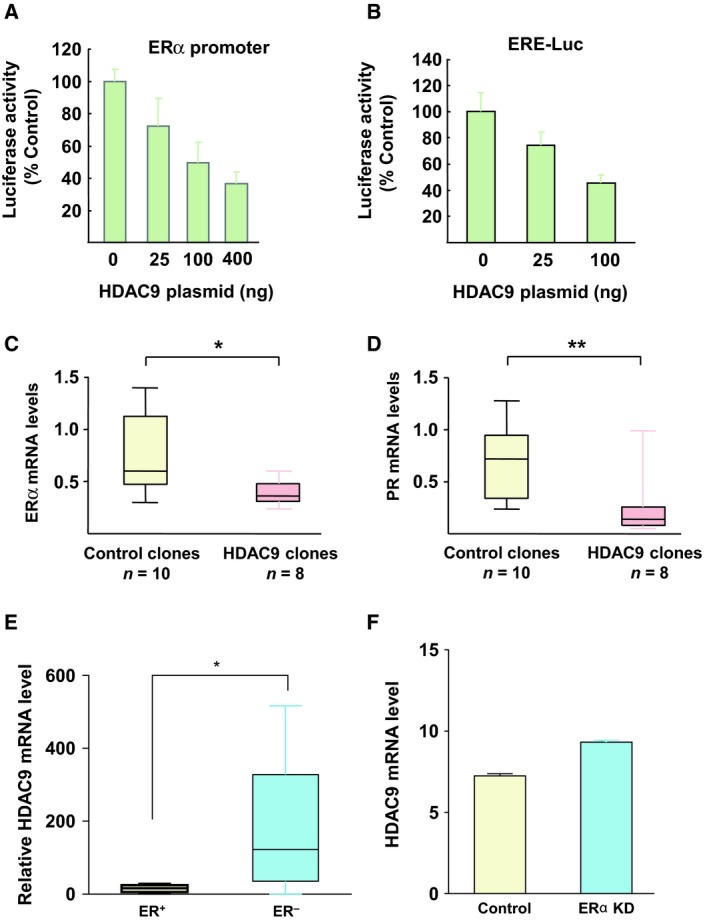
Figure 1.

Cross talk between HDAC9 and ERα signaling in breast cancer cells. (A) MCF7 cells were cotransfected with a 4‐kb fragment of the ERα promoter and increasing concentrations of full length HDAC9. Results represent the luciferase activity measured after normalization to Renilla luciferase activity and relative to the values obtained in cells not transfected with the HDAC9 plasmid (control). Data are the mean ± SD of triplicate wells and are representative of two independent experiments. (B) The same as in panel A, but with cells cotransfected with an ERE‐luciferase reporter plasmid and increasing concentrations of full length HDAC9. (C) Total RNA was extracted from control (empty vector; n = 10) and HDAC9‐overexpressing cell clones (n = 8). ERα mRNA levels were quantified using RT‐qPCR. Results represent the mean FC ± SD vs control MCF7 cells; *P < 0.05, **P < 0.01 (Mann–Whitney test). (D) The same as in panel C, but for PGR mRNA. (E) Total RNA was extracted from ERα‐positive or ERα‐negative breast cancer cell lines and ERα mRNA levels were quantified using RT‐qPCR; *P < 0.05. (F) HDAC9 expression levels in parental and MCF7 cells with silenced ERα expression (205659_at probe set) were extracted from the GEO profile GSE27473 and compared (Al Saleh et al., 2011).
