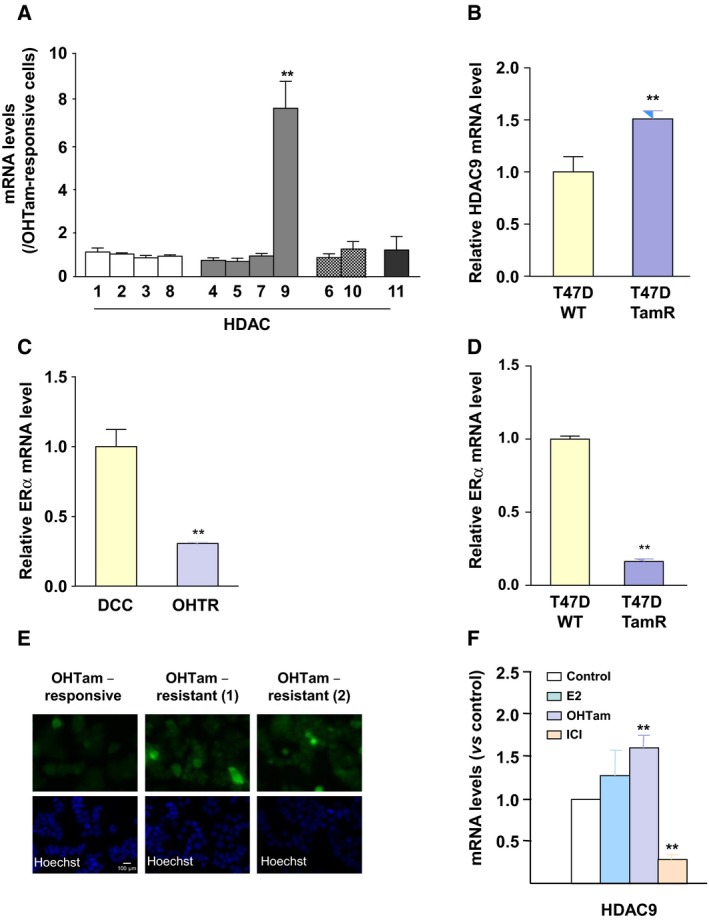
Figure 2.

HDAC9 expression in antiestrogen‐resistant breast cancer cells. (A) Total RNA was extracted from OHTam‐sensitive and OHTam‐resistant MCF7 cell lines and HDAC mRNA levels were quantified by RT‐qPCR. Results represent the mean ± SD of three independent cell cultures and are expressed relative to the HDAC mRNA levels of OHTam‐responsive cells, used as reference; **P < 0.01 (Mann–Whitney test compared with OHTam‐responsive cells). (B) HDAC9 mRNA levels were quantified by RT‐qPCR in T47D TamR cells (Mishra et al., 2018). Results are expressed relative to the HDAC mRNA levels in parental cells and represent the mean ± SD of five independent cell cultures; **P < 0.001 (t‐test compared with parental T47D cells). (C) Total RNA was extracted from OHTam‐responsive (DCC) and resistant (OHTR) MCF7 cells and ERα mRNA levels were quantified by RT‐qPCR. Results represent the mean ± SD of three independent cell cultures and are expressed relative to the ERα mRNA levels in DCC cells, used as reference; **P < 0.01 (Mann–Whitney test compared with DCC cells). (D) The same as in panel B for the quantification of ERα mRNA levels by RT‐qPCR in T47D TamR cells. (E) HDAC9 expression was analyzed by immunofluorescence in OHTam‐responsive MCF7 cells and in two sets of OHTam‐resistant MCF7 cells (1 and 2) using an anti‐HDAC9 antibody (top panel); nuclei were stained with Hoechst (bottom panel). Scale bar corresponds to 100 μm. (F) MCF7 cells were incubated with 10−8 M E2, OHTam, ICI or solvent alone (EtOH; Control) for 20 h and then HDAC9 mRNA levels were quantified by RT‐qPCR. Results are expressed relative to the HDAC mRNA levels in control cells and represent the mean ± SD of three independent cell cultures; **P < 0.01 (Mann‐Whitney test compared with control cells).
