Figure 4.

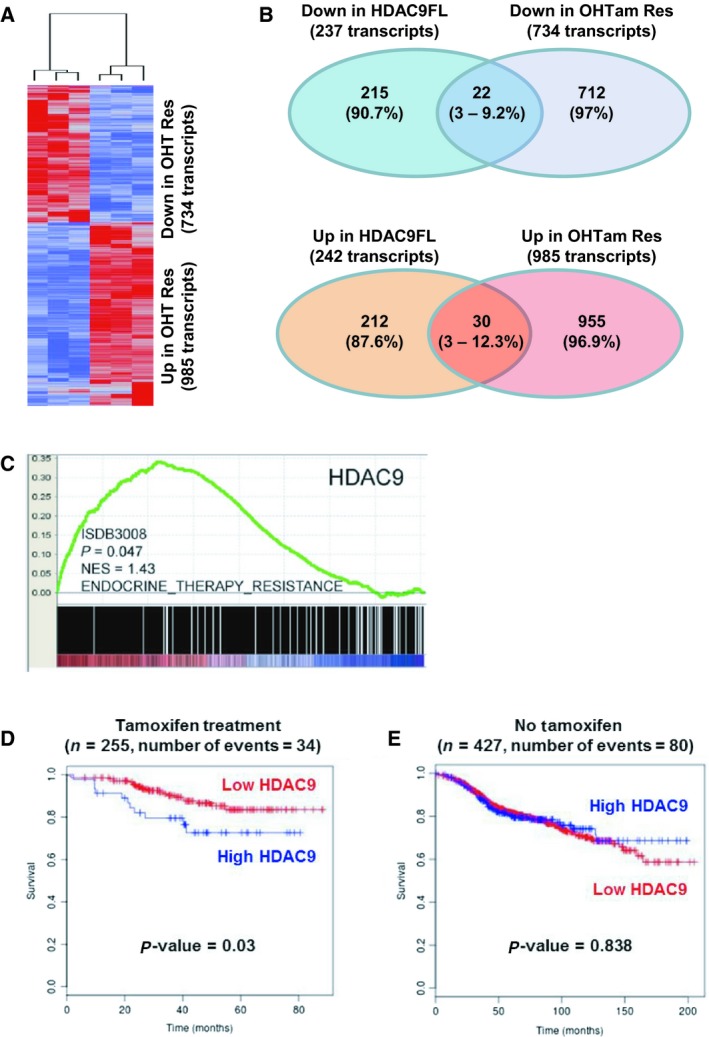
Transcriptomic analyses in MCF7 cells and expression in human breast cancer tumors. (A) The molecular signatures of OHTam‐sensitive and OHTam‐resistant MCF7 cells were visualized by hierarchical clustering of the 1719 genes that are differentially expressed in the two conditions (genes are arranged in rows and samples in columns). For each condition, a tree represents the relationship among samples and the branch lengths reflect the degree of similarity between samples according to the gene expression profile. In red, upregulated genes; in blue, downregulated genes. (B) Schematic representation showing the overlap between downregulated (top drawing) and upregulated (bottom drawing) transcripts in MCF7‐HDAC9FL and OHTam‐resistant MCF7 cells. The number (percentage) of transcripts deregulated in each condition is indicated. (C) GSEA of HDAC9 mRNA expression relative to the endocrine therapy resistance gene set in breast cancer (n = 2795 samples). (D) Kaplan–Meier analysis with the BreastMark algorithm of survival in patients with breast cancer treated with tamoxifen (n = 255 tumor samples) relative to HDAC9 expression using a low cutoff analysis (lower quartile). Disease‐free survival was considered as the survival end point and if not available, distant disease‐free survival or overall survival was used. Significance was calculated using the log rank test. (E) The same as in panel D, but for untreated patients (n = 427 tumor samples).
