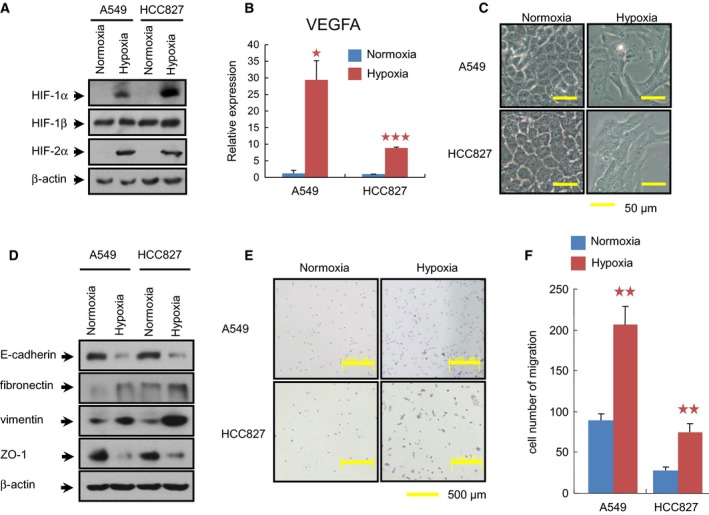
Figure 1.

Induction of EMT by hypoxia in NSCLC cell lines. (A) Analysis of HIF proteins in cells exposed to normoxia (21% O2) or hypoxia (1% O2) for 6 h prior to preparation of whole‐cell extracts. (B) The effect of hypoxic exposure for 72 h on the transcriptional level of VEGFA was further evaluated by real‐time qPCR. The relative expression value for VEGFA mRNA was normalized on the basis of its RPLP0 content. All the assays were performed in triplicate, and the data are shown as the mean values ± SEM. The asterisks denote significant differences (*P < 0.05; ***P < 0.001) within experiments, as determined by the Student's t‐test. (C) Morphological changes in cells treated with hypoxia for 72 h (Bars = 50 μm). Both A549 and HCC827 lost their epithelial honeycomb‐like morphology and obtained a spindle‐like shape. (D) Cellular protein levels of E‐cadherin, fibronectin, vimentin, and ZO‐1 affected by hypoxia for 72 h were determined by western blotting. β‐Actin was employed to ensure equal loading. E‐cadherin and ZO‐1 were down‐regulated, whereas fibronectin and vimentin were up‐regulated when cells were subjected to hypoxia. (E) As determined by transwell assay, the migratory cells under normoxia and hypoxia for 72 h were visualized by staining with crystal violet. (F) Quantification of these migratory cells determined by transwell assay in (E). Hypoxia treatment for 72 h clearly increased the migration of the cells of both cell lines. **P < 0.01, as evaluated using the Student's t‐test.
