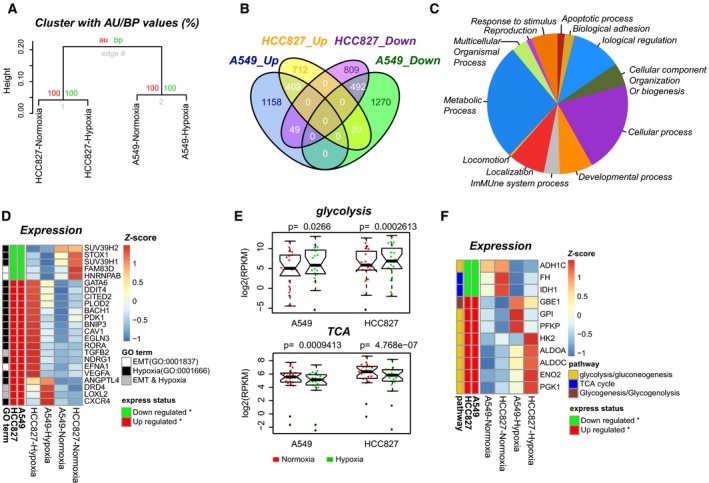
Figure 2.

Extensive gene expression changes related to the hypoxia response, EMT and glycometabolism. (A) Hierarchical clustering of 16 620 commonly expressed genes between the two cell lines and the two cell states. (B) Venn diagram showing the shared and distinct DEGs between the two cell lines. (C) Classification of GO‐slim biological processes for the 901 DEGs shared between the two cell lines. (D) Heat map showing the 23 DEGs related to the GO terms of EMT and the response to hypoxia. Row annotation tracks indicate the expression status and GO terms of each DEG. (E) Gene expression changes related to glycolysis (up) and the TCA cycle (bottom) during epithelial (red) to mesenchymal (green) transition. The P value of a two‐tailed t‐test is given. (F) Heat map showing the 11 DEGs involved in glycometabolism. Row annotation tracks indicate the expression status and relative pathways of each DEG.
