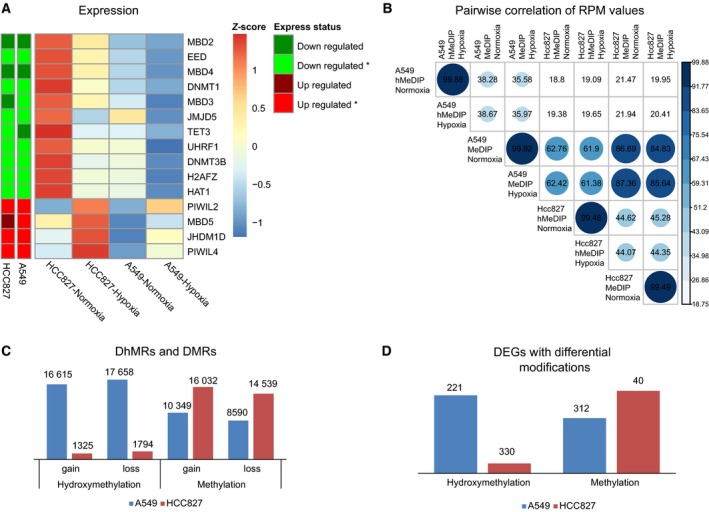
Figure 3.

Differences in epigenetic modifications associated with gene expression in NSCLC cells. (A) The expression of 15 genes associated with epigenetics. Row annotation tracks indicate the expression status of each gene in the two cell lines. *Mean significant changes in expression. (B) Pairwise correlations of epigenetic modification levels in all samples. The RPM values per 2 kb of the genome were used to calculate Pearson's correlations. (C) Numbers of DMRs and DhMRs in the two cell lines. (D) Numbers of DEGs harboring differential epigenetic modifications in each cell line.
