
Figure 5.
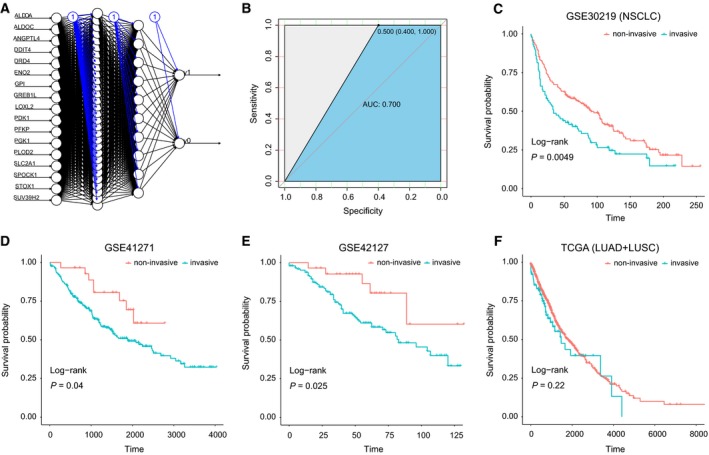
Training and validation of the 17‐gene panel by gene expression datasets of NSCLC patients. (A) Schematic display of the artificial neural network analysis using the 17‐gene signature; (B) the receiver operating characteristic curve (ROC) analysis of the 17‐gene signature in the training dataset; an ANN algorithm was applied to classify the NSCLC samples from GEO datasets, including (C) GSE30219 (n = 149), (D) GSE41271 (n = 275), and (E) GSE42127 (n = 176). A dataset containing 21 SCLC samples were also analyzed (F). Survival analyses are applied to the two classified groups, as indicated in the column annotation (red and blue bars). Wald test p values are given for each survival analysis.