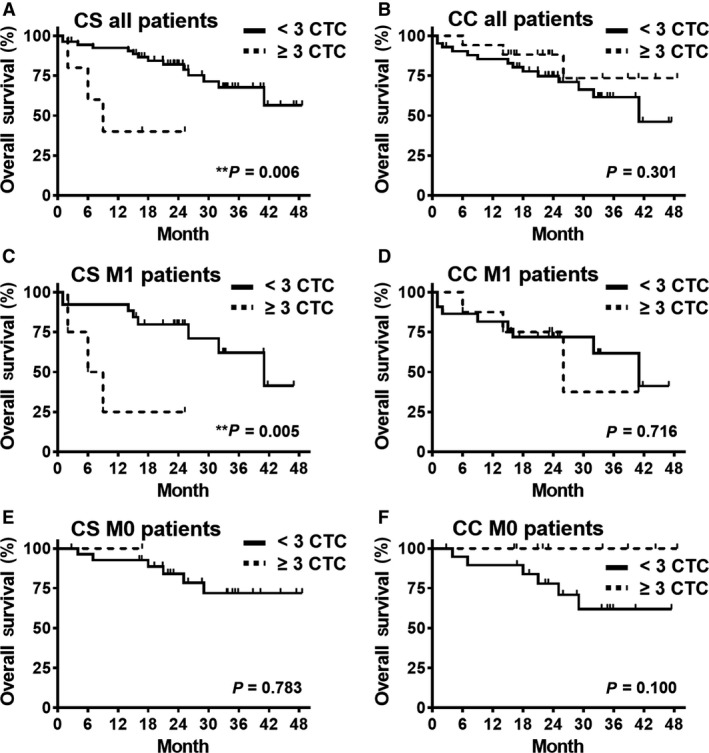
Figure 2.

(A) + (B) Kaplan–Meier graph showing overall survival of all 59 primary CRC patients with complete resection (R0) stratified for detection of ≥ 3 CTCs using CS or CC. (C–F) Kaplan–Meier graph showing the same for all 30 metastatic (M1) and all 29 nonmetastatic (M0) patients with R0 resection. One patient with survival < 30 days was excluded. P ‐values calculated with log‐rank test and shown in graph.
