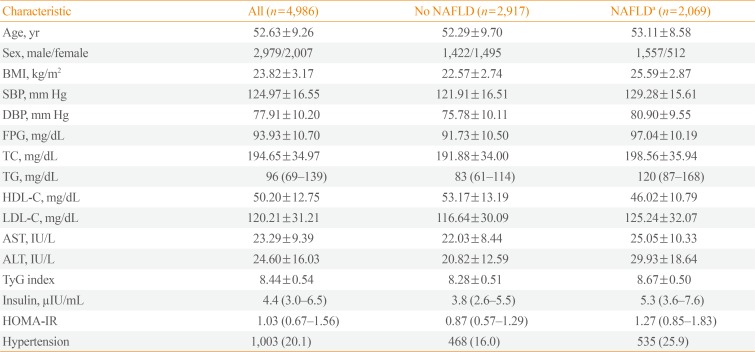
Table 1. Clinical Characteristics of the Study Subjects Based on NAFLD Status.
Values are expressed as mean±SD, median (interquartile range), or number (%).
NAFLD, nonalcoholic fatty liver disease; BMI, body mass index; SBP, systolic blood pressure; DBP, diastolic blood pressure; FPG, fasting plasma glucose; TC, total cholesterol; TG, triglyceride; HDL-C, high density lipoprotein cholesterol; LDL-C, low density lipoprotein cholesterol; AST, aspartate aminotransferase; ALT, alanine aminotransferase; TyG, triglyceride glucose; HOMA-IR, homeostasis model assessment of assessment of insulin resistance.
aIntergroup comparison using Student's t test, all P<0.01.

