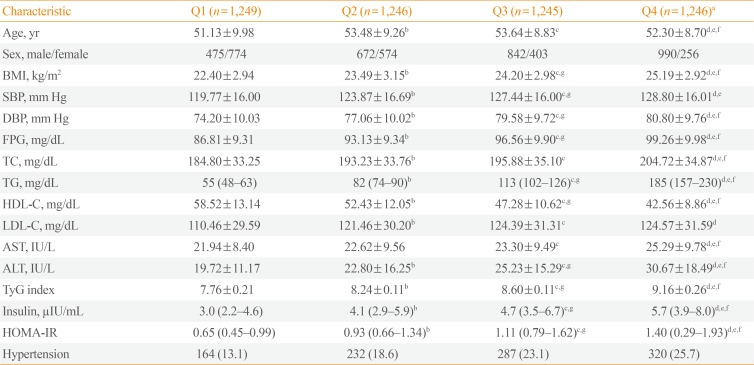
Table 2. Clinical Characteristics of the Study Participants Based on TyG Index.
Values are expressed as mean±SD, median (interquartile range), or number (%).
TyG, triglyceride glucose; BMI, body mass index; SBP, systolic blood pressure; DBP, diastolic blood pressure; FPG, fasting plasma glucose; TC, total cholesterol; TG, triglyceride; HDL-C, high density lipoprotein cholesterol; LDL-C, low density lipoprotein cholesterol; AST, aspartate aminotransferase; ALT, alanine aminotransferase; HOMA-IR, homeostasis model assessment of insulin resistance.
aIntergroup comparisons using one-way analysis of variance, all P<0.01; bP<0.05 between Q1 and Q2; cP<0.05 between Q1 and Q3; dP<0.05 between Q1 and Q4; eP<0.05 between Q2 and Q4; fP<0.05 between Q3 and Q4; gP<0.05 between Q2 and Q3.

