
Figure 4.
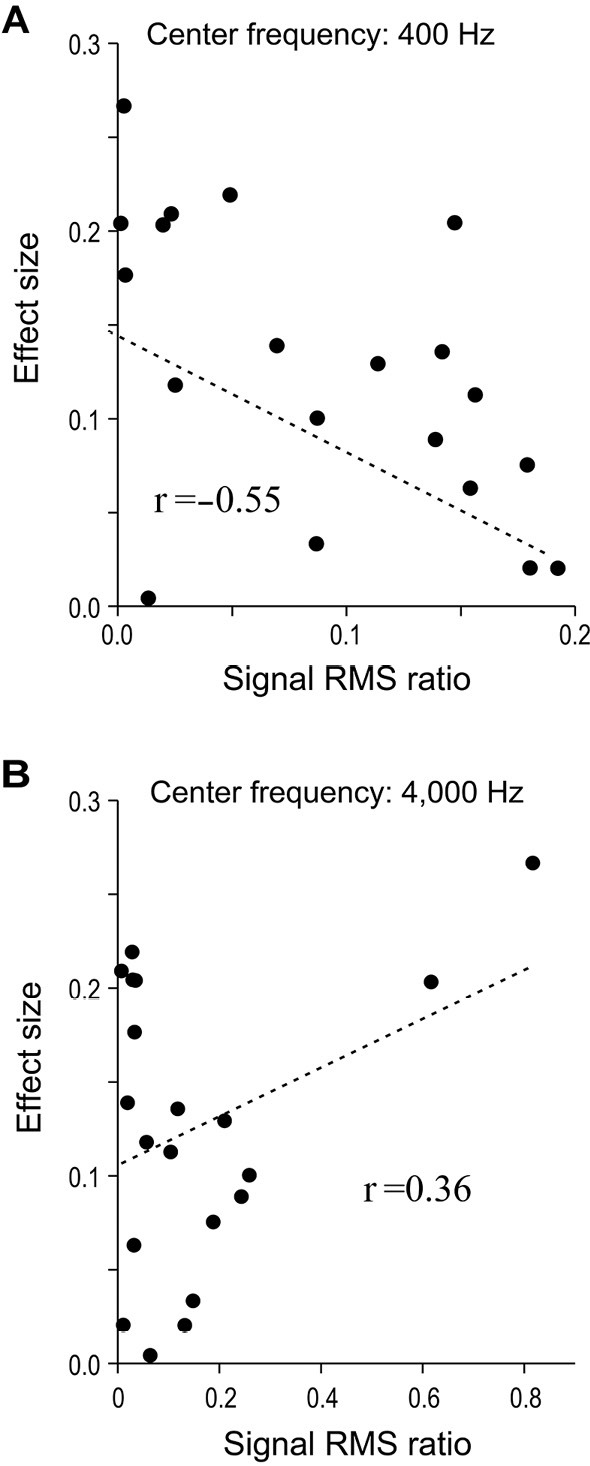
Relative contribution of designated frequency bands to overall signal versus effect size for all sound stimuli. The horizontal axis indicates the “signal root-mean-square (RMS) ratio”: the strength of the relative contribution of sound in a frequency band centered at the designated frequency to the raw signal. The vertical axis indicates the “effect size”: the magnitude of the rating gap between migraineurs and controls. A and B show this relationship for extracted partial signals with central frequencies of 400 and 4,000 Hz, respectively. One data point corresponds to a single sound type (n=20 per graph).