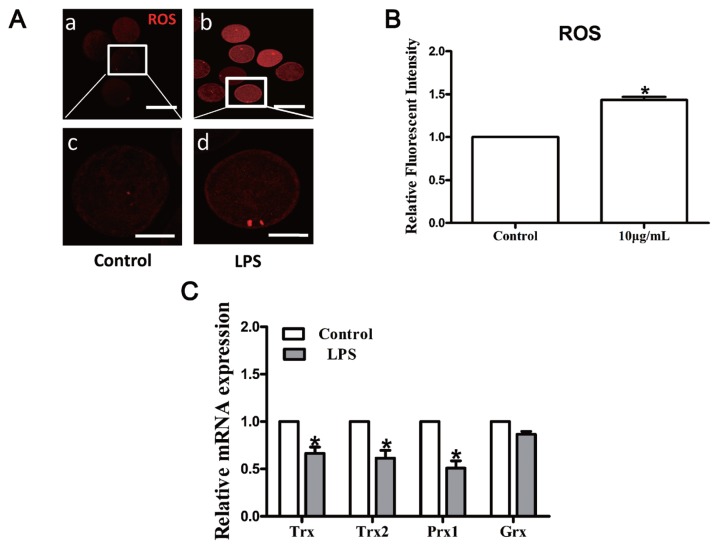
Figure 4.
LPS treatment alters intracellular redox state in bovine oocytes. (A) Representative photomicrographs. Red, ROS. a, b: Bar = 100 μm; c, d: Bar = 50 μm. (B) ROS expression after LPS treatment. (C) Transcripts of redox signaling-associated genes Trx, Trx2, Prx1, and Grx. LPS, lipopolysaccharide; ROS, reactive oxygen species; Trx, thioredoxin; Prx1, peroxiredoxin 1; Grx, glutaredoxin. Asterisk indicates significant difference (p<0.05).

