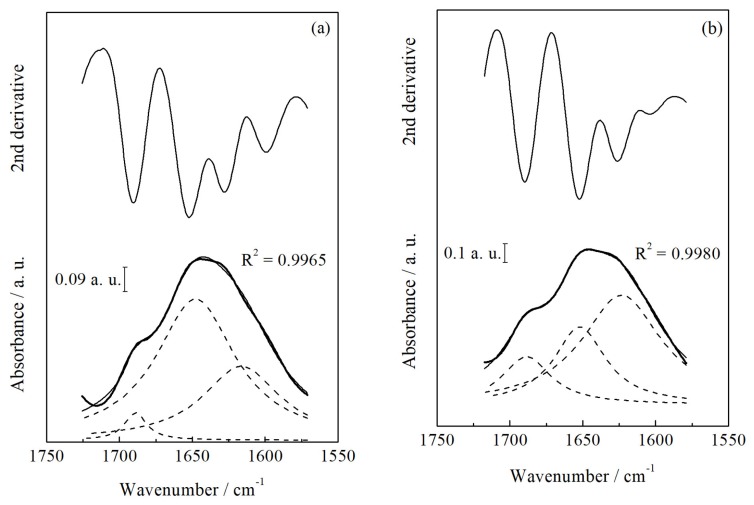
Figure 1.
Fourier transform infrared spectroscopy in an attenuated reflectance mode (FTIR-ATR) deconvoluted spectra of chicken breast meat samples from broiler carcass scalding at 56°C/150 s (T3) (a) and at 58°C/90 s (T5) (b) in a wavenumber range from 1,720 to 1,570 cm−1 corresponding the amide I band. Original FTIR-ATR spectrum (thick solid line); Gaussian curve-fit (solid line); peaks from deconvolution analysis (dashed lines).

