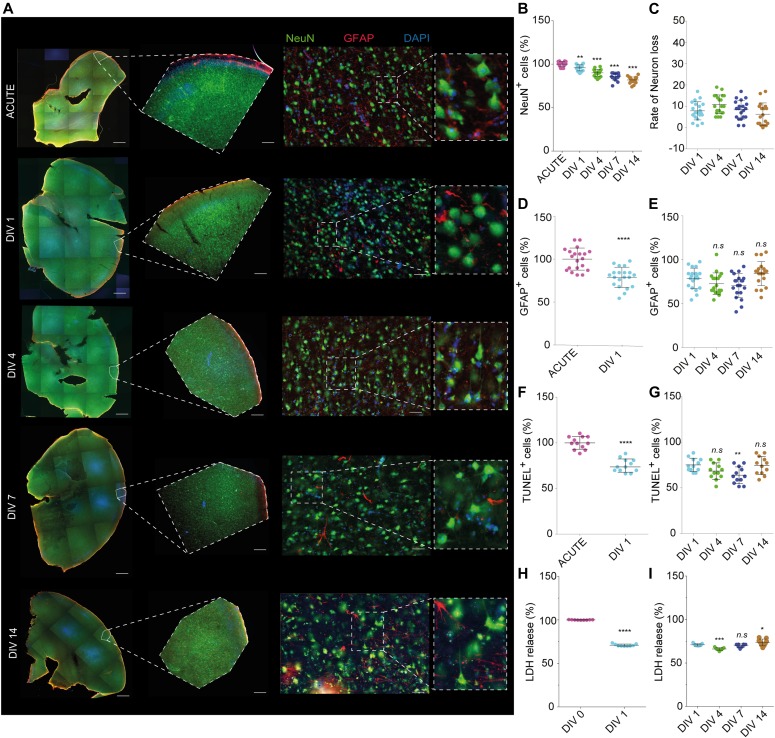
Figure 3. Vitality quantification of human brain section model.
Acute sections were collected from each batch as control. Sections cultivated for weeks were then compared with acute sections, with N = 20 patients. (A) From left to right: 5× tiled representative fluorescence images of tissue sections for Acute, DIV1, DIV4, DIV7, and DIV14. Sections were costained against the neuronal marker (NeuN), astrocyte marker (GFAP), and nuclei (DAPI Fluoromount). Scale bars are 1 mm; representative 5× image of each time point showing the cytoarchitecture of the slice. Scale bars are 200 μm; representative 20× image of each time point showing neurons (NeuN), astrocytes (GFAP), and nucleus (DAPI). Scale bars are 50 μm. (B–E) Quantification of NeuN (neurons) positive staining demonstrated a significant difference in the distribution of neuronal sections between fresh versus cultured sections (P < 0.0001). (C) Quantification of rate of neuronal loss showed a negligible reduction over DIV1–14. (D) Quantification of GFAP (astrocytes) shows an increase on fresh sections versus DIV1 because of injury (P < 0.00001), and (E) quantification of astrocytes loss shows a nonsignificant difference from DIV1 to 14 (DIV4 = −5.97%, DIV7 = −8.15%, and DIV14 = 5.58%, one-way ANOVA with Bonferroni correction for multiple comparisons). (F) Cellular necrosis in the brain slice cultures was done using a TUNEL assay for N = 3 patients at different time points. (G) Quantification of TUNEL-positive cells shows a nonsignificant difference from DIV1 to 14 (DIV4 = 6.74%, DIV7 = 11.35%, and DIV14 = 0.613%). (H) Cellular metabolism was quantified using an LDH assay in different time points. (I) Quantification of LDH assay shows a nonsignificant difference from DIV1 to 14 (DIV4 = 33.87%, DIV7 = 34.51%, and DIV14 = 26.31%). Statistics were performed using unpaired t test with Welch’s correction. *P < 0.05, **P < 0.001, ***P < 0.0001, ****P < 0.00001, ns = nonsignificant. A representative result of three independent experiments is shown (error bar represents ± SD).

