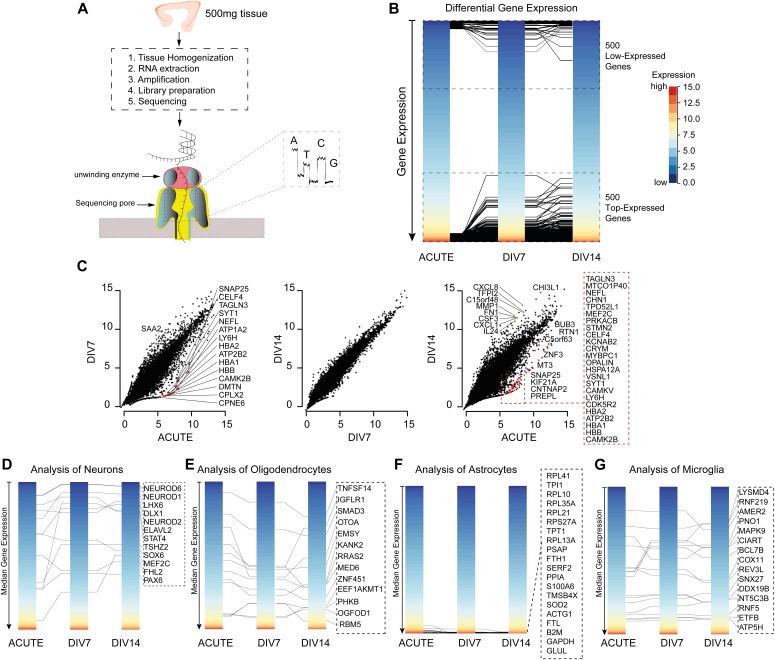
Figure 5. Gene expression analysis.
(A) Workflow of an RNA-seq experiment with ∼500 mg tissue using Nanopore MinION. After the culture period specified, the tissue was homogenized, RNA extracted, amplified, the library prepared, and sequenced from N = 3 patients. (B) Differential bulk gene expression showing top 500 up- and down-regulated genes. The top 500 up- and down-regulated genes lay within the same expression region. (C) Comparison of the gene expression profile at different time points. The gene expression profile exhibits a change in expression from the acute to DIV7. However, the expression profile remains stable when compared between DIV7 and DIV14. (D–G) Cell-specific expression profiles of neurons, oligodendrocytes, astrocytes, and microglia. Key genes from each cell type are shown in the dotted box next to the expression plot. The cell-specific signatures were chosen based on their fidelity score. The scale bar for y-axis is global as represented in (B).

