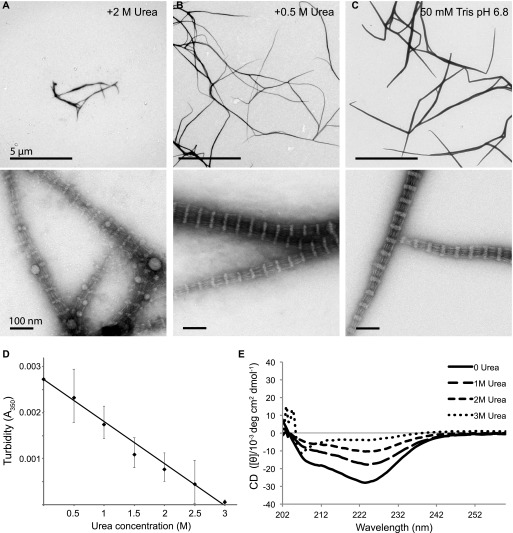
Figure 3. Filament formation and stability of FilP secondary structure in urea.
(A–C) Negative staining EM images of FilP dialyzed against Tris assembly buffers containing different urea concentrations ranging from 0.5 to 2 M. (D) Filament-induced adsorption by turbidity measurement at 350 nm of FilP in increasing urea concentrations shows filament stability in the presence of urea. The average of three experiments is shown, and error bars represent the SD, P ≤ 0.05, which was calculated using a one-way ANOVA test. (E) CD analysis of FilP dialyzed against Tris assembly buffer containing 0–3 M urea shows the stability of the α-helical folded structure in the presence of urea.

