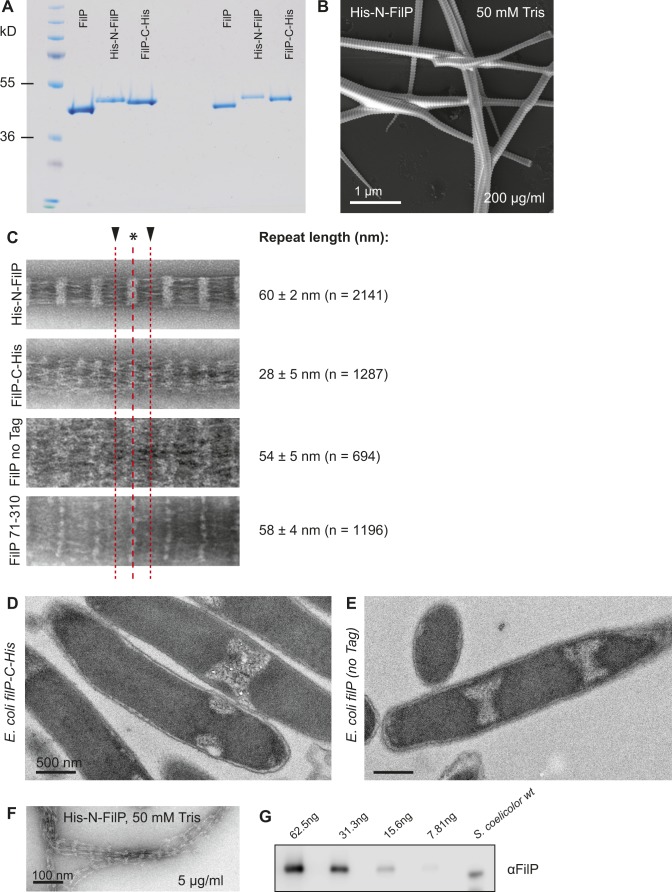
Figure S2. FilP purification and polymerization with and without tag.
(A) Coomassie-stained SDS-PAGE from E. coli affinity-purified non-tagged and N- and C-terminally 6×His-tagged FilP. (B) SEM image of FilP filament bundles, stained with uranyl acetate and imaged with Zeiss Merlin EF-SEM. Same grid as Fig 2A, showing the surface of the striated banding pattern of the structure, which is too thick to be imaged by TEM. (C) Comparison of FilP striation structure aligned to major and minor bands for all protein constructs used in this study, including a construct lacking the N-terminal head and first coiled-coil domain of the protein: FilP aa 71–310. The length of the repetitive banding pattern on FilP filament bundles is listed as a table next to the respective images. The FilP filament bundle major band is indicated by a black arrowhead and minor bands by asterisks (*). (D, E) Thin-section TEM images of E. coli BL21 induced to express FilP-C-His (D) and non-tagged FilP (E) from pETM vectors. Compartmentation of the cytoplasm into protein-dense volumes is an effect of overexpression of filament-forming proteins. (F) Negative staining EM image of affinity-purified N-terminally tagged FilP at low concentration (5 μg/ml). (G) Example of a Western blot used for endogenous FilP concentration estimations.

