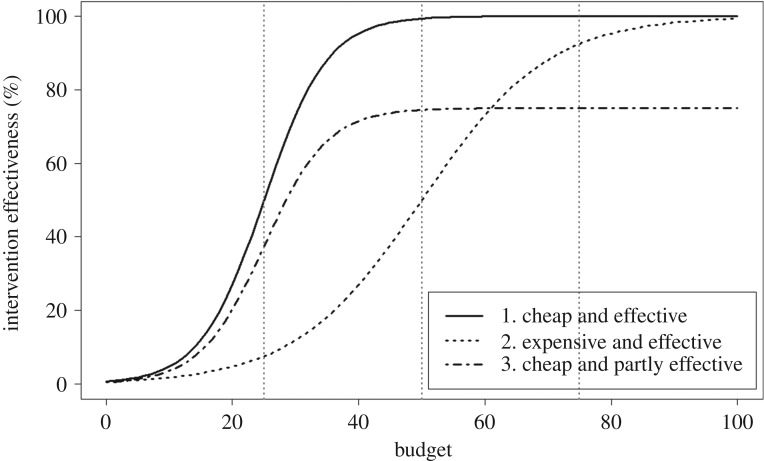
Figure 3.
Illustration of three different types of relationship between the expected effect of candidate interventions and the corresponding budget (on a scale of 0–100). The three dotted grey vertical lines at budgets of 25, 50 and 75 represent low, intermediate and high budget levels, respectively.

