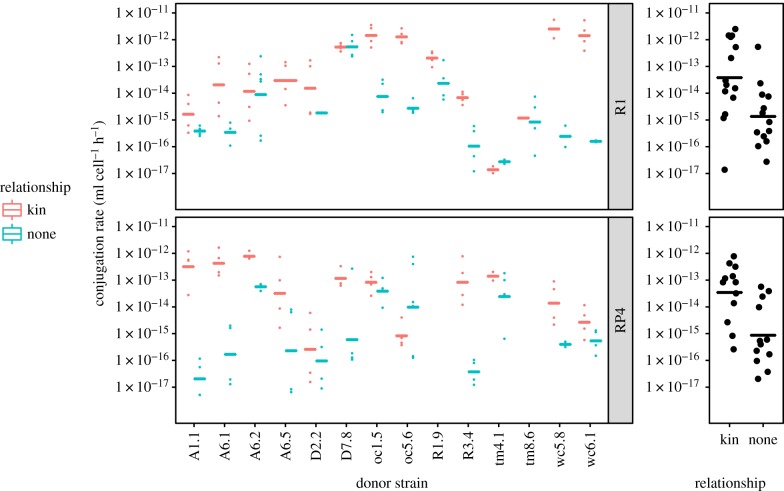
Figure 2.
Variable transfer rates among field isolates and bias towards kin. Mating assays were performed for 3 h, with donors containing either R1 or RP4 plasmid. Pairs are shown ordered by donor isolate, with the recipient isolate being the same as the donor (kin, red) or another field isolate with distinct serotype and isolation site (non-kin, light blue, see electronic supplementary material, table S1 for recipient identity). Individual replicates are shown as dots, lines are geometric means. Summary graphs at the right show average transfer per couple of strains (dots) and overall geometric means per treatment (lines). Electronic supplementary material, figure S5 presents the same data ordered by recipient isolate.

