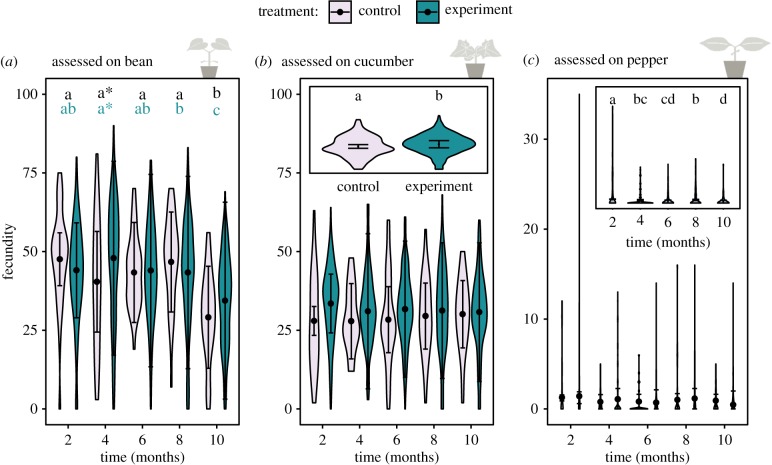
Figure 2.
Evolutionary dynamics for control and experimental populations: changes in performance (i.e. number of eggs after 6 days). (a) Assessed on bean. Time, origin (control or experiment) and their interaction significantly affect performance. The black letters indicate significant differences in time for the control and in blue for the experiment; the asterisk shows the difference between both treatments. (b) Assessed on cucumber. Only treatment affects performance significantly, which is visualized in the inserted plot). (c) Assessed on pepper. Only time has a significant effect on performance as indicated in the inserted plot. The violin plots show the observed data, while the points and lines show the mean model estimates and their 95% confidence interval, respectively. (Online version in colour.)

