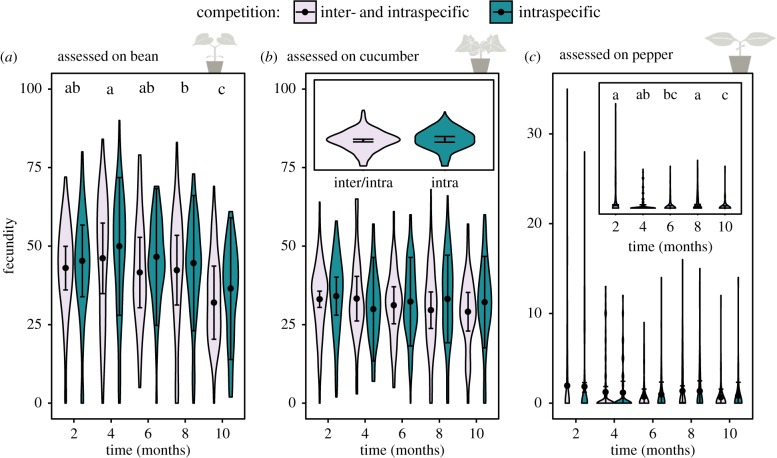
Figure 3.
Evolutionary dynamics for experimental populations. Changes in performance (i.e. number of eggs after 6 days). (a) Assessed on bean. The time and the presence or absence of interspecific competition significantly affect performance. The black letters indicate significant differences in time. Mites under interspecific competition had a significantly lower performance. (b) Assessed on cucumber. Only competition was included in the final model, which is visualized in the inserted plot. (c) Assessed on pepper. Only time has a significant effect on performance as indicated in the inserted plot. The violin plots show the observed data, while the points and lines show the mean model estimates and their 95% confidence interval, respectively. (Online version in colour.)

