Figure 2.
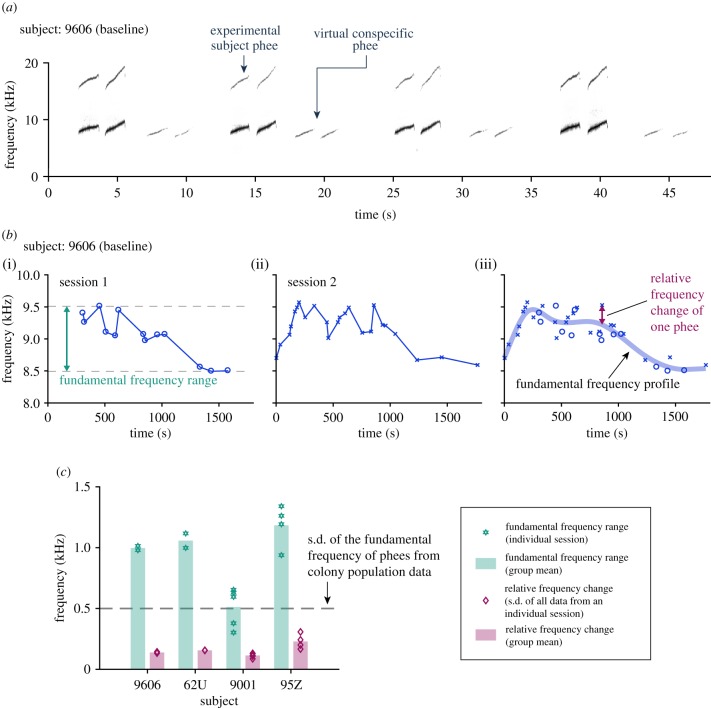
Spontaneous change in the fundamental frequency. (a) Example recording clip (spectrograms) from one of the baseline 1 sessions showing the exchange of phee calls from an experimental subject (9606) and the ‘virtual conspecific’ during antiphonal calling. (b) (i) Fundamental frequencies with respect to call onset time for the first session of baseline 1 from an experimental subject (9606). Each marker indicates a call. The x-axis is the time within individual sessions. Time zero indicates the start of a session. (ii) Same format as in (i), for the second session in baseline 1. (iii) The circles and crosses correspond to the data shown in (i) and (ii), respectively. The fundamental frequency profile (thick blue curve) is fitted from individual data points from all sessions in baseline 1 (see Material and methods, there are two sessions in total for this subject in baseline 1). The relative frequency change is indicated for one example phee call. (c) Comparison of two parameters (illustrated in b) of the spontaneous change in the fundamental frequency (in baseline 1) to the statistics of phee calls in the colony. Parameter 1 is the fundamental frequency range (see b(i)) (group mean: green bars; individual sessions: green stars). Parameter 2 is the standard deviation (s.d.) of relative frequency changes of all phee calls within an individual session (see b(iii)) (group mean: pink bars; s.d. of all data from an individual session: pink diamonds). The statistics of phee calls in the colony is the standard deviation of the fundamental frequency of phee calls from a population of marmosets recorded in the colony (dashed line) (see table IV of reference [41]). (Online version in colour.)

