Figure 3.
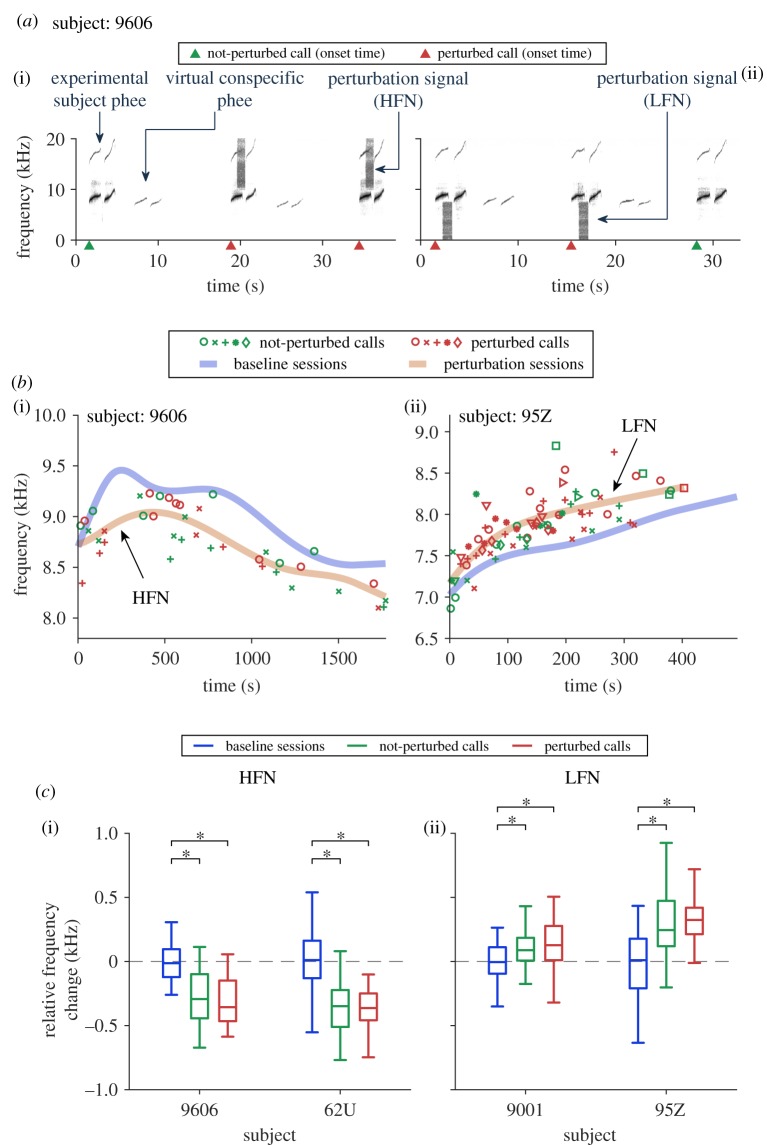
The fundamental frequency of phee calls shifts away from perturbation signal spectrum. (a) Example recordings from perturbation sessions. Perturbation signals overlapped with some of the phee calls from the experimental subject ((i) high-frequency noise, or HFN; (ii) low-frequency noise, or LFN). The green and red triangles mark the onset time of not-perturbed and perturbed calls, respectively. (b) Fundamental frequencies with respect to call onset time within perturbation 1 sessions compared to the fundamental frequency profile in baseline 1 sessions. Each marker indicates a call (same type of markers for calls in the same session)—green: not-perturbed; red: perturbed. The fundamental frequency profile (fitted from individual data points, figure 2b(iii) and Material and methods) of baseline 1 sessions is marked with a thick blue curve and that of perturbation 1 sessions is marked with a thick orange curve. The x-axis is the time within individual sessions. Time zero indicates the start of a session. (c) Statistical summary of the relative frequency change (Tukey boxplot) of calls in baseline (blue), not-perturbed (green) and perturbed (red) conditions for baseline 1 and perturbation 1 sessions. Medians: horizontal lines inside the boxes. First and third quartiles: lower and upper borders of the boxes. Inner fences: whiskers outside of the boxes. Outliers are not plotted. Any comparison showing a significant difference between conditions is indicated with asterisks. See electronic supplementary material, table S2 for the p-values. (Online version in colour.)

