Figure 4.
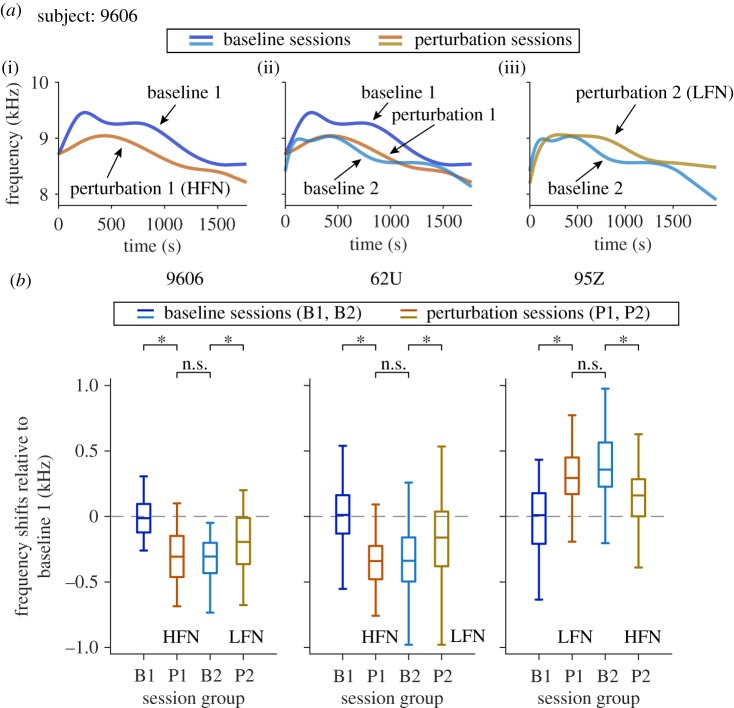
Long-lasting effects of the perturbation signals. (a) Change in fundamental frequency profile between adjacent session groups of an example subject (9606). Blue and cyan: baseline sessions. Orange and brown: perturbation sessions. The x-axis is the time within individual sessions. Time zero indicates the start of a session. (b) Fundamental frequency shifts (Tukey boxplot) over time in experimental session order, with respect to baseline 1 sessions (for subjects 9606, 62U and 95Z). Medians: horizontal lines inside the boxes. First and third quartiles: lower and upper borders of the boxes. Inner fences: whiskers outside of the boxes. Outliers are not plotted. Calls in perturbation sessions include both the not-perturbed and the perturbed calls. B1: baseline 1; P1: perturbation 1; B2: baseline 2; P2: perturbation 2. Asterisks indicate significant differences. n.s., not significant. See electronic supplementary material, table S3 for the p-values. (Online version in colour.)

