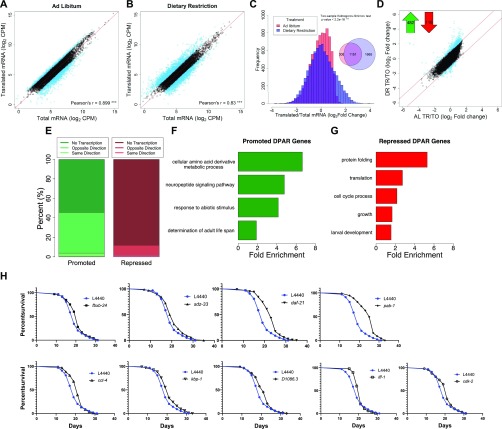
Figure 2. DR modulates selective translation in C. elegans.
(A, B) Gene abundance between fractions was well correlated under (A) AL and (B) DR (P-value < 0.001, Pearson's correlation of 0.899 and 0.830, respectively). Black circles represent genes that showed no significant difference (FDR > 0.05) between total and translated mRNA. Blue circles represent genes with twofold or greater change. A reference line with a slope of one is shown in red. Units are counts aligned per million sequenced (CPM). (C) Distribution of gene abundance fold changes between translated and total mRNA for AL (red) and DR (blue) worms. The distribution of changes was significantly different between diets (two-sample Kolmogorov–Smirnov test, P < 2.2 × 10⁻¹⁶). (D) Translational promotion and repression of genes between diets were calculated using the DPAR. Black circles represent genes with similar translation: transcription expression ratios between diets. Blue circles represent genes with twofold or greater DPAR. Red lines delineate the twofold change cutoff. Inset, 482 genes were translationally promoted and 116 genes were translationally repressed. (E) Percent of translationally promoted or repressed DPAR genes in which changes in the total fraction were either in the same direction (light hue), opposite direction (medium hue), or were not significant (dark hue; Log2 FC > 2, FDR < 0.05). (F, G) Biological GO terms associated with translationally (F) promoted or (G) repressed DPAR genes under DR. P < 0.05, modified Fisher's exact test. Functionally similar GO terms from identical groups of genes were manually removed. (H) Genes down-regulated under DR which resulted in life span extension when knock-downed in C. elegans under well-fed conditions. One representative replicate is shown; all replicates performed can be found in Table S6. The % change in median life span and P-value from the log-rank test comparing with L4440 empty vector controls are: fxbx-24 (10.5%, 0.030), sdz-33 (5.3%, 0.025), daf-21 (21.1%, 2.00E-16), pab-1 (31.6,% 2.00E-16), cct-4 (10.5%, 0.011), kbp-1 (10.5%, 0.006), D1086.3 (10.5%, 0.005), iff-1 (10.5%, 0.004), cdk-2 (10.5%, 0.031). fxbx-24 and sdz-33 were regulated transcriptionally under DR, D1086.3 was regulated transcriptionally and translationally, and all other genes were predominantly regulated translationally.

