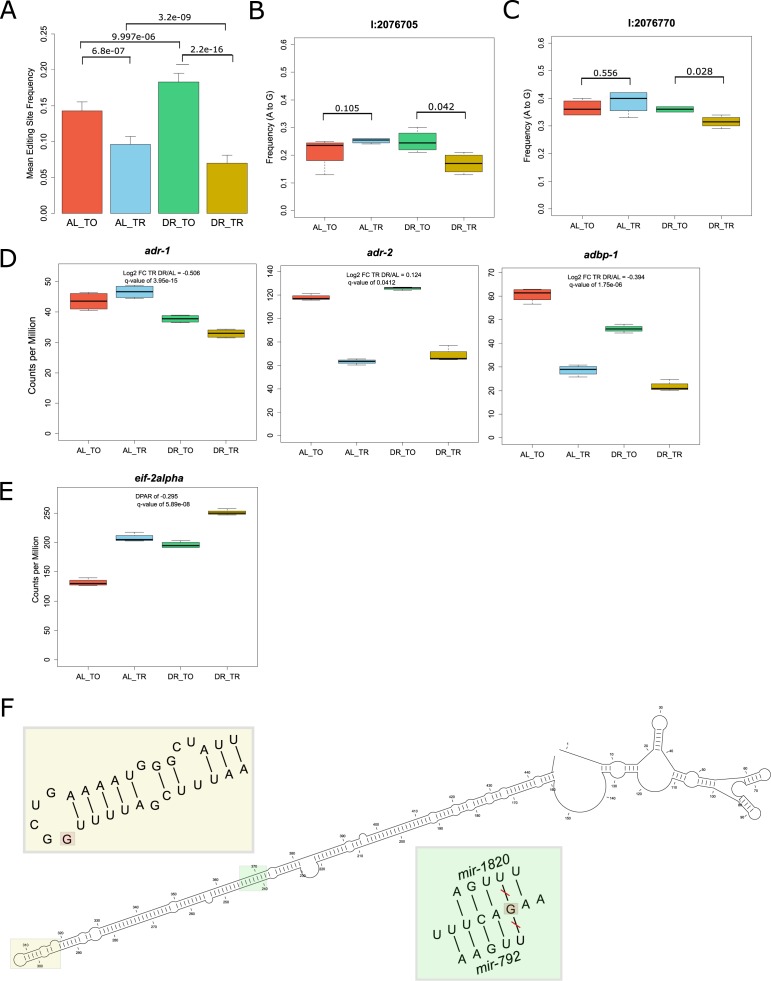
Figure S3. Altered A-to-I editing in 3′ UTR of eif-2alpha.
(A) Average frequency of A-to-I editing in total and translated fractions across diets among all 331 sites detected. As with the number of overall sites in Fig 4A, the frequency of edits increases among total mRNA under DR but is further attenuated within the translated fraction. P-values from Wilcoxon rank sum test between indicated comparisons are given, n = 331. Error bars are SEM. (B, C) The mean editing frequency at position (B) 2076705 bp and (C) 2076770 bp on chromosome 1 within the 3′ UTR of eif-2alpha. These edits decrease in frequency in the translation fraction under DR. P-values are given for comparisons between fractions, Wilcoxon rank sum test, n = 4. (D) Expression of the genes adr-1, adr-2, and adbp-1 under well-fed conditions (AL) or under DR in the total RNA (TO) fraction on in the translated (TR) fractions. The log2 fold change in expression between DR and AL in the translated fraction is given along with the associated q-value. (E). Expression of eif-2alpha under the total and translated fractions across diets as expressed in the number of reads aligned per million reads generated. (F) Predicted secondary structure of the 3′ UTR of eif-2alpha (CLC Main Workbench, ver 8.1). Yellow inset provides a zoomed in view of the stem loop marked in yellow containing the edit at position 2076705 (marked in red). Green inset provides a zoomed in view of the edit at position at 2076705 (marked in red). The predicted seed match pairing of mir-1820 and mir-792 from TargetScanWorm (ver 6.2) are shown. TO, total mRNA; TR, translated mRNA.

