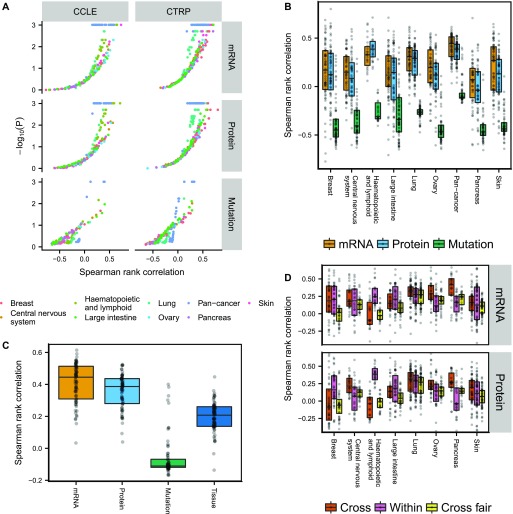
Figure 5. Drug sensitivity predictions from CCLE data.
(A, B) Spearman rank correlation after cross-validation between predicted and measured drug sensitivity. The two different drug sensitivity censuses are combined in (B–D) by averaging the Spearman rank correlations for drug sensitivities predicted in both censuses. (C) Pan-cancer drug sensitivity predictions using either genomic/transcriptomic/proteomic data or tumor type. (D) All cell lines belonging to the tumor type specified by the x-axis were excluded and the remaining cell lines used for building drug sensitivity models (Cross). The models were then tested in the excluded cell lines. Alternatively, the cross-tumor–type models were trained on an equal number of randomly selected cell lines as the target tissue (Within) to make the comparison fair (Cross fair). Drugs with low coefficient of variation (σ/μ < 0.2) either across the target tissue cell lines or the remaining cell lines were filtered out.

