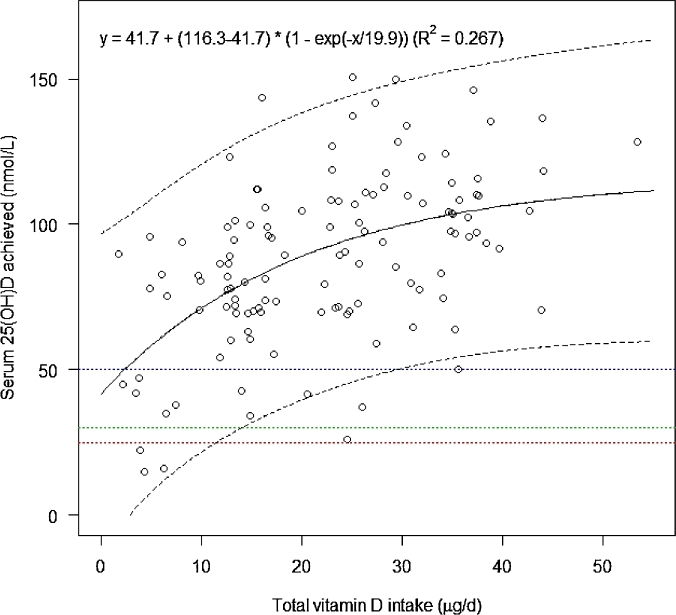
FIGURE 3.
The relation between achieved serum 25(OH)D concentrations and total vitamin D intake in pregnant women living at 51.9°N, assessed by using a curvilinear regression model. The mean response is indicated by the central line, and the outer lines are its 95% prediction intervals; n = 128. Horizontal lines represent serum 25(OH)D thresholds of 25, 30, and 50 nmol/L, respectively. 25(OH)D, 25-hydroxyvitamin D.

